Track Network Usage
In the SD-WAN Portal, you can track network usage by monitoring upload and download trends over time. The usage graph allows you to analyze data transfer metrics and adjust the visualization for a more detailed view.
How to Track Network Usage
Follow these steps to monitor network usage:
-
Log in to the SD-WAN Portal.
-
Navigate to Network > Usage.
-
Select a service from the dropdown list.
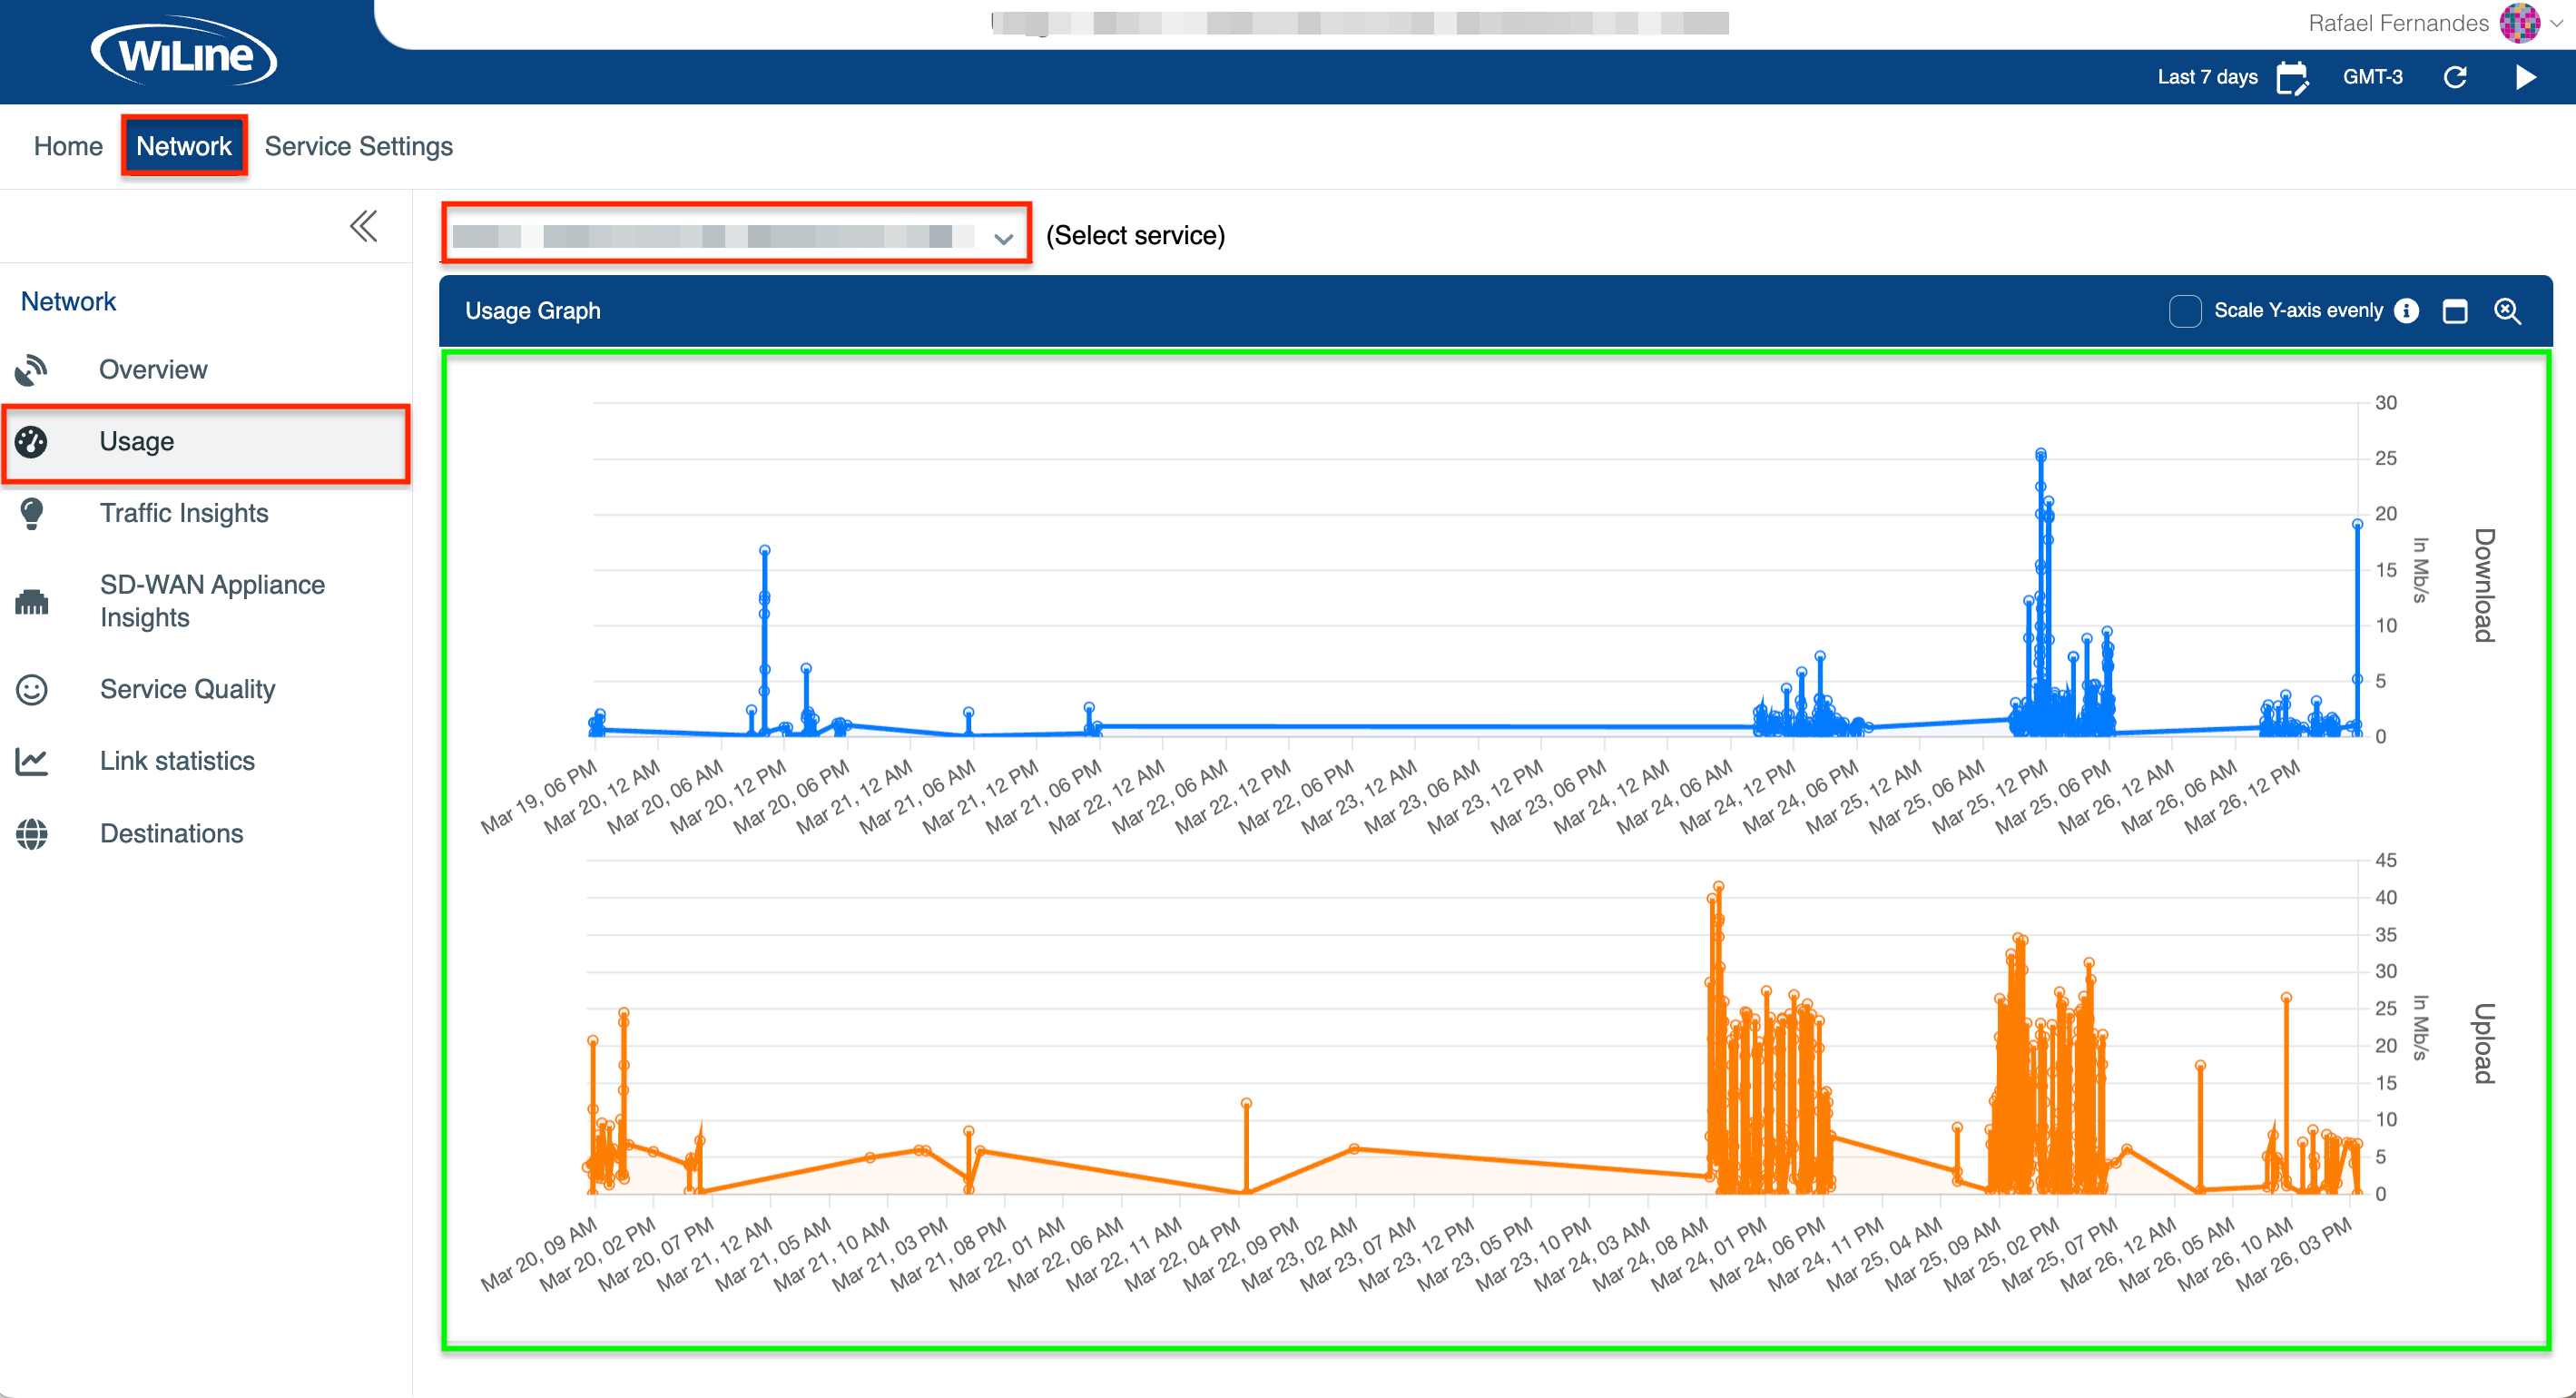
If the selected service supports network usage tracking, a usage graph will appear, displaying download and upload trends over time:

Figure 1: Network usage trends and insights: download and upload.This visualization helps users analyze data transfer patterns and network performance.
importantNot all services support network usage graphs. Only specific service types are available at this time.
-
Analyze the usage graph:
- Download and Upload Data by Time: View trends over a selected period.
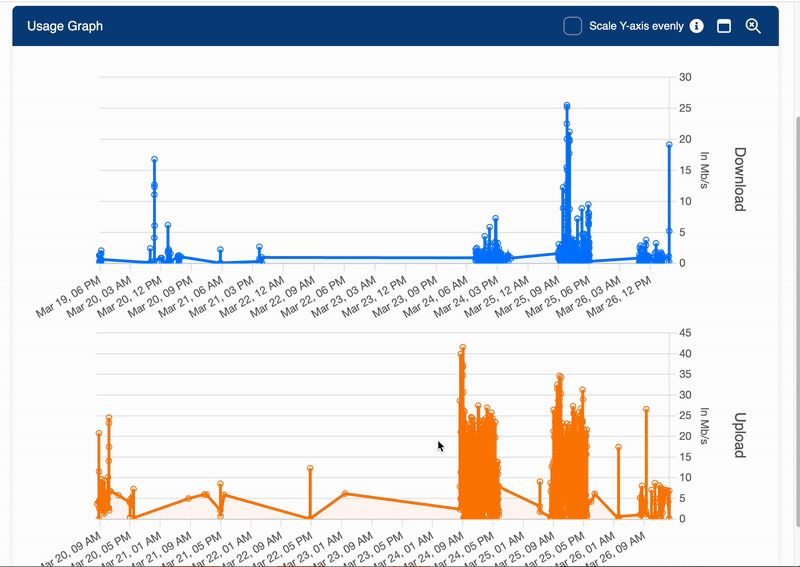
- Scale Y-Axis Evenly: Click this option to synchronize the Y-axis scales for both graphs, ensuring a proportional comparison without cropping data.
- Single Graph View: Switch to a combined view where download and upload data are displayed together.

Figure 2: Scale Y-Axis evenly and enable single graph view.The usage graph helps users identify patterns in network activity, such as peak usage times, bandwidth consumption trends, and potential bottlenecks. By analyzing download and upload data over time, users can make informed decisions about optimizing network performance and resource allocation.
Filter Results
You can refine your network usage graph by selecting a specific time range, adjusting the time zone, and enabling auto-refresh for real-time updates.
-
Time Zone Selection: Click the Local Time icon (e.g., GMT-3) in the top-right corner to change the displayed time zone to options such as UTC, PST, or MST.
-
Time Range Customization: Click the
icon to filter data over a specific period:- Custom Date Range: Manually select a start and end date/time to focus on precise periods.
- Predefined Options: Choose from preset timeframes such as
Last 15 Minutes,Last 30 Minutes,Last Hour,Last 8 Hours, orLast 7 Daysfor quick filtering.
-
Preset Time Filters: Use predefined shortcuts to quickly switch between timeframes like
Last 2 days 5 hours 2 minutes, which will be displayed in a user-friendly format. -
Auto-Refresh: Enable automatic updates to refresh data at 10-second intervals. Use the
button to activate it or the button to stop updates.
- Dynamic Refreshing: Depending on data load and the selected range, the refresh interval may vary between 10 and 60 seconds.
- Applies to Predefined Ranges: Auto-refresh works only for preset timeframes (
Last...). It is disabled for manually selected custom ranges.
The visualization tools allow you to interpret network activity efficiently and make informed decisions about bandwidth allocation and performance monitoring.
With these features, the SD-WAN Portal provides a clear and interactive way to monitor network usage and optimize network performance.