Check SD-WAN Appliance
In the SD-WAN Portal, you can monitor the SD-WAN Appliance to gain insights into hardware usage and memory consumption. This helps optimize performance, detect issues, and ensure efficient resource allocation.
How to Check SD-WAN Appliance
To access SD-WAN appliance data:
- Log in to the SD-WAN Portal.
- Click on an expanded site item from the sites/services table, or
- Navigate to Network > SD-WAN Appliance Insights.
System Utilization Graphs
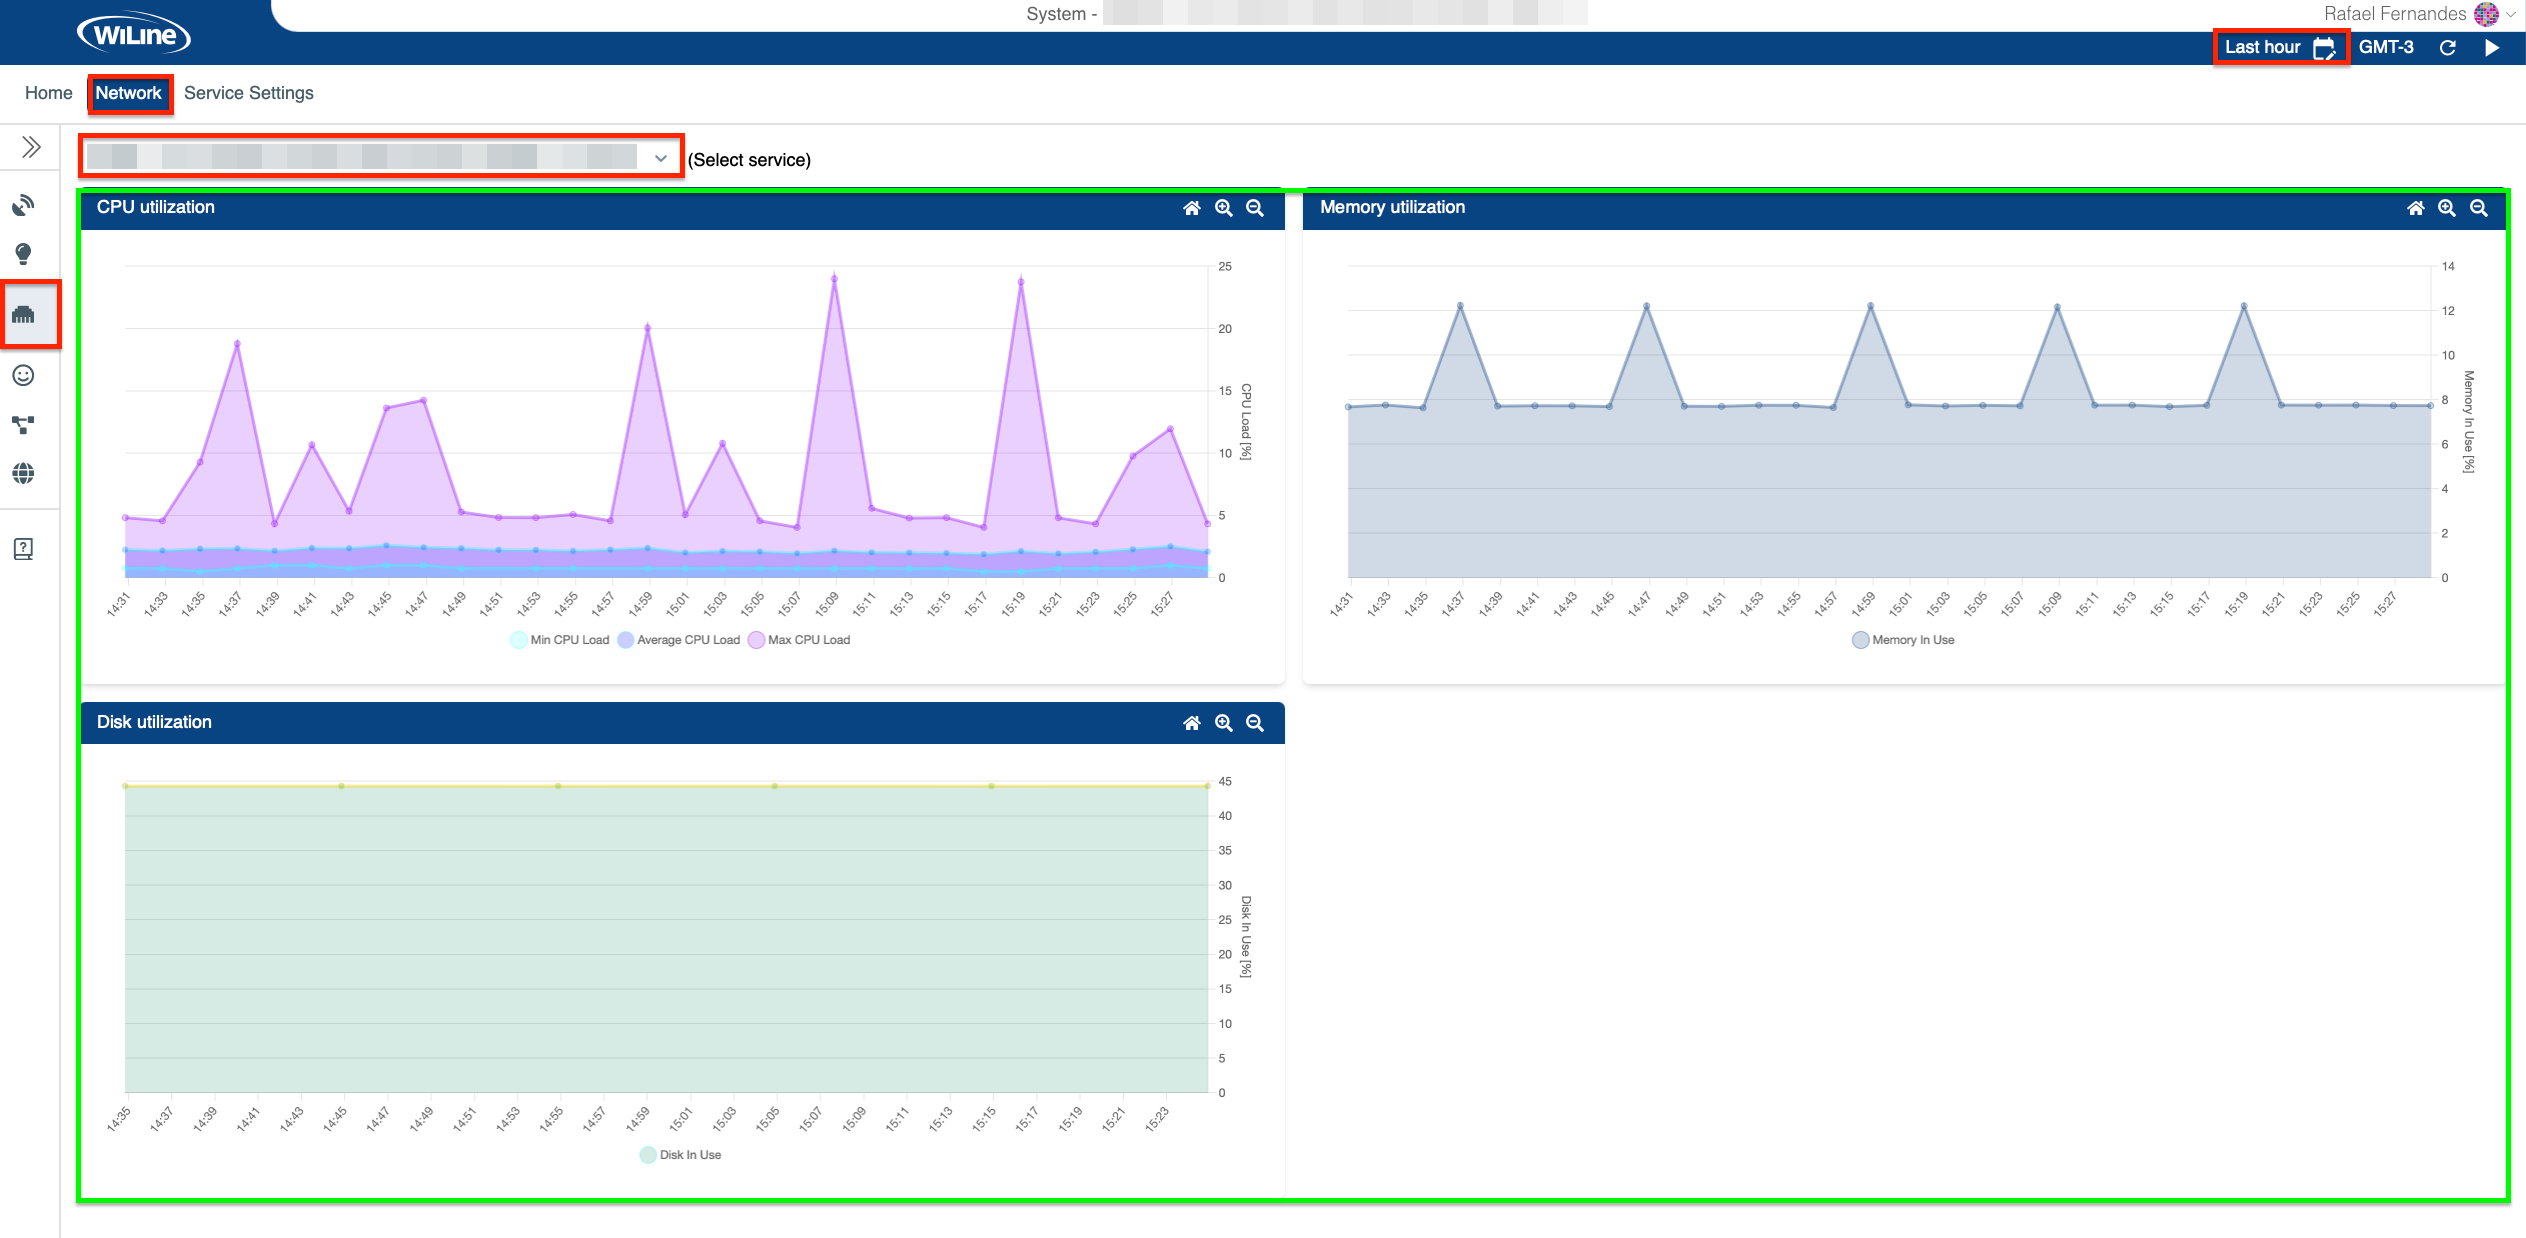
You will see three key graphs displaying:

Figure 1: Exploring System Utilization.
- CPU Utilization: This graph shows the percentage of CPU resources used over time. High utilization may indicate that the system is under heavy load, potentially impacting performance. The graph includes:
- Minimum CPU Load: The lowest recorded CPU usage.
- Average CPU Load: The mean CPU usage over the selected time period.
- Maximum CPU Load: The highest recorded CPU usage.
When evaluating CPU performance, focus on consistency and peak load times. Peaks indicate the highest CPU usage, helping to identify bottlenecks, while monitoring individual loads provides insights for optimizing resource allocation.
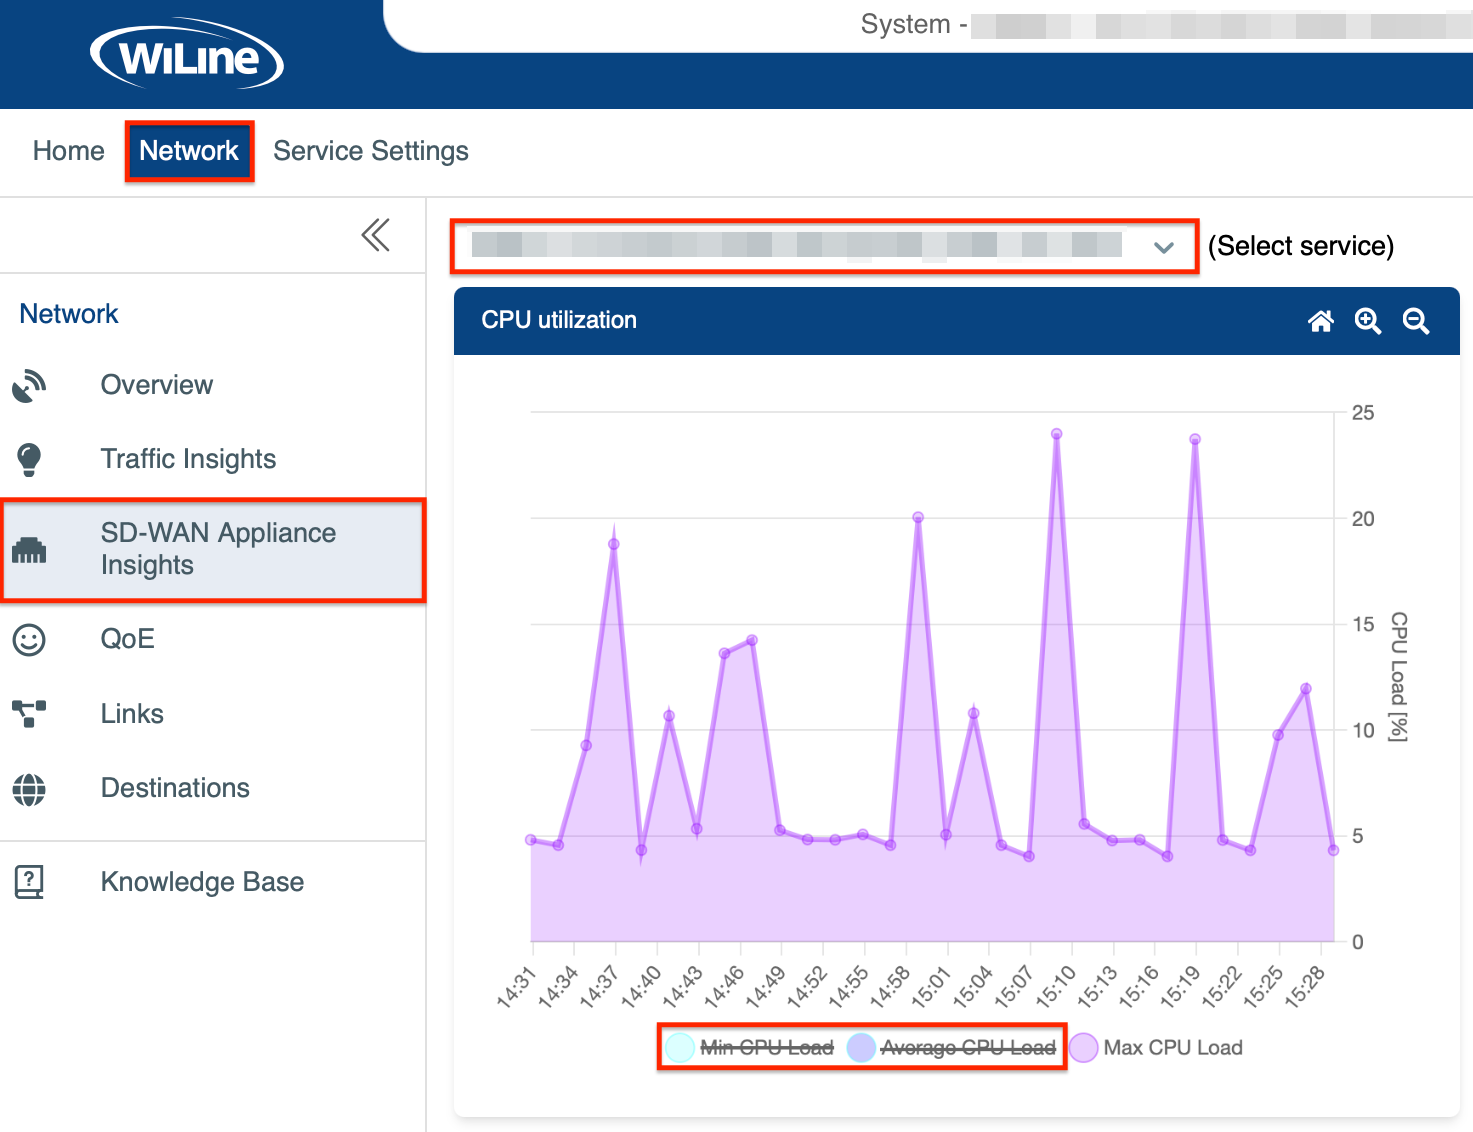
For clearer viewing, simply click on a load line from the graph to eliminate it:

Figure 2: Focused Graph: Eliminating Min and Average CPU Load Values.
-
Memory Utilization: This graph represents the amount of memory used compared to the total available memory. Monitoring memory usage helps identify potential bottlenecks and ensures efficient operation.
-
Disk Utilization: This graph displays the percentage of disk space in use. High disk utilization can lead to slower read/write speeds and may affect overall system performance.
Utilization charts change colors to indicate usage limits:
- CPU: Yellow above 40%, Red above 70%.
- Memory: Yellow above 50%, Red above 70%.
- Disk: Yellow above 30%, Red above 60%.
Filter Results
Customize your network data by adjusting the time zone, time range, and refresh settings:
-
Time Zone: Click the Local Time icon (e.g., GMT-3) in the top-right corner to switch to a different time zone (e.g., UTC, PST, MST).
-
Time Range: Use the
icon to adjust the range:- Custom Dates: Define a specific range:
- From:
01/12/2024, 10:00 - To:
03/12/2024, 18:30
- From:
- Quick Ranges: Select predefined intervals like
Last 15 Minutes,Last Hour, orLast 24 Hours.
- Custom Dates: Define a specific range:
-
Preset: Define a custom interval (e.g.,
Last 2d 4h 15mfor 2 days, 4 hours, and 15 minutes). -
Auto Refresh: Enable automatic updates to refresh data at regular intervals (e.g., every 10 seconds). Click
to activate or to pause the refresh.
- Dynamic Timing: The default refresh interval is 10 seconds, but it may extend up to
60 secondsdepending on data load times and range size. - Preset Ranges Only: Auto-refresh applies only to
Last...presets. Custom ranges are excluded, and the refresh buttons are hidden for them.
These options ensure tailored insights, helping you monitor and analyze your network activity.
Refresh Results
If you don't see your filtered results right away, click the
icon in the top-right corner.These graphs from System Utilization provide a comprehensive visual representation of your system's performance, assisting you in identifying potential issues.