Monitor Service Quality
The SD-WAN Portal provides a Service Quality section for real-time insights, demonstrating how SD-WAN enhances connection stability and optimizes network management.
How to View Service Quality
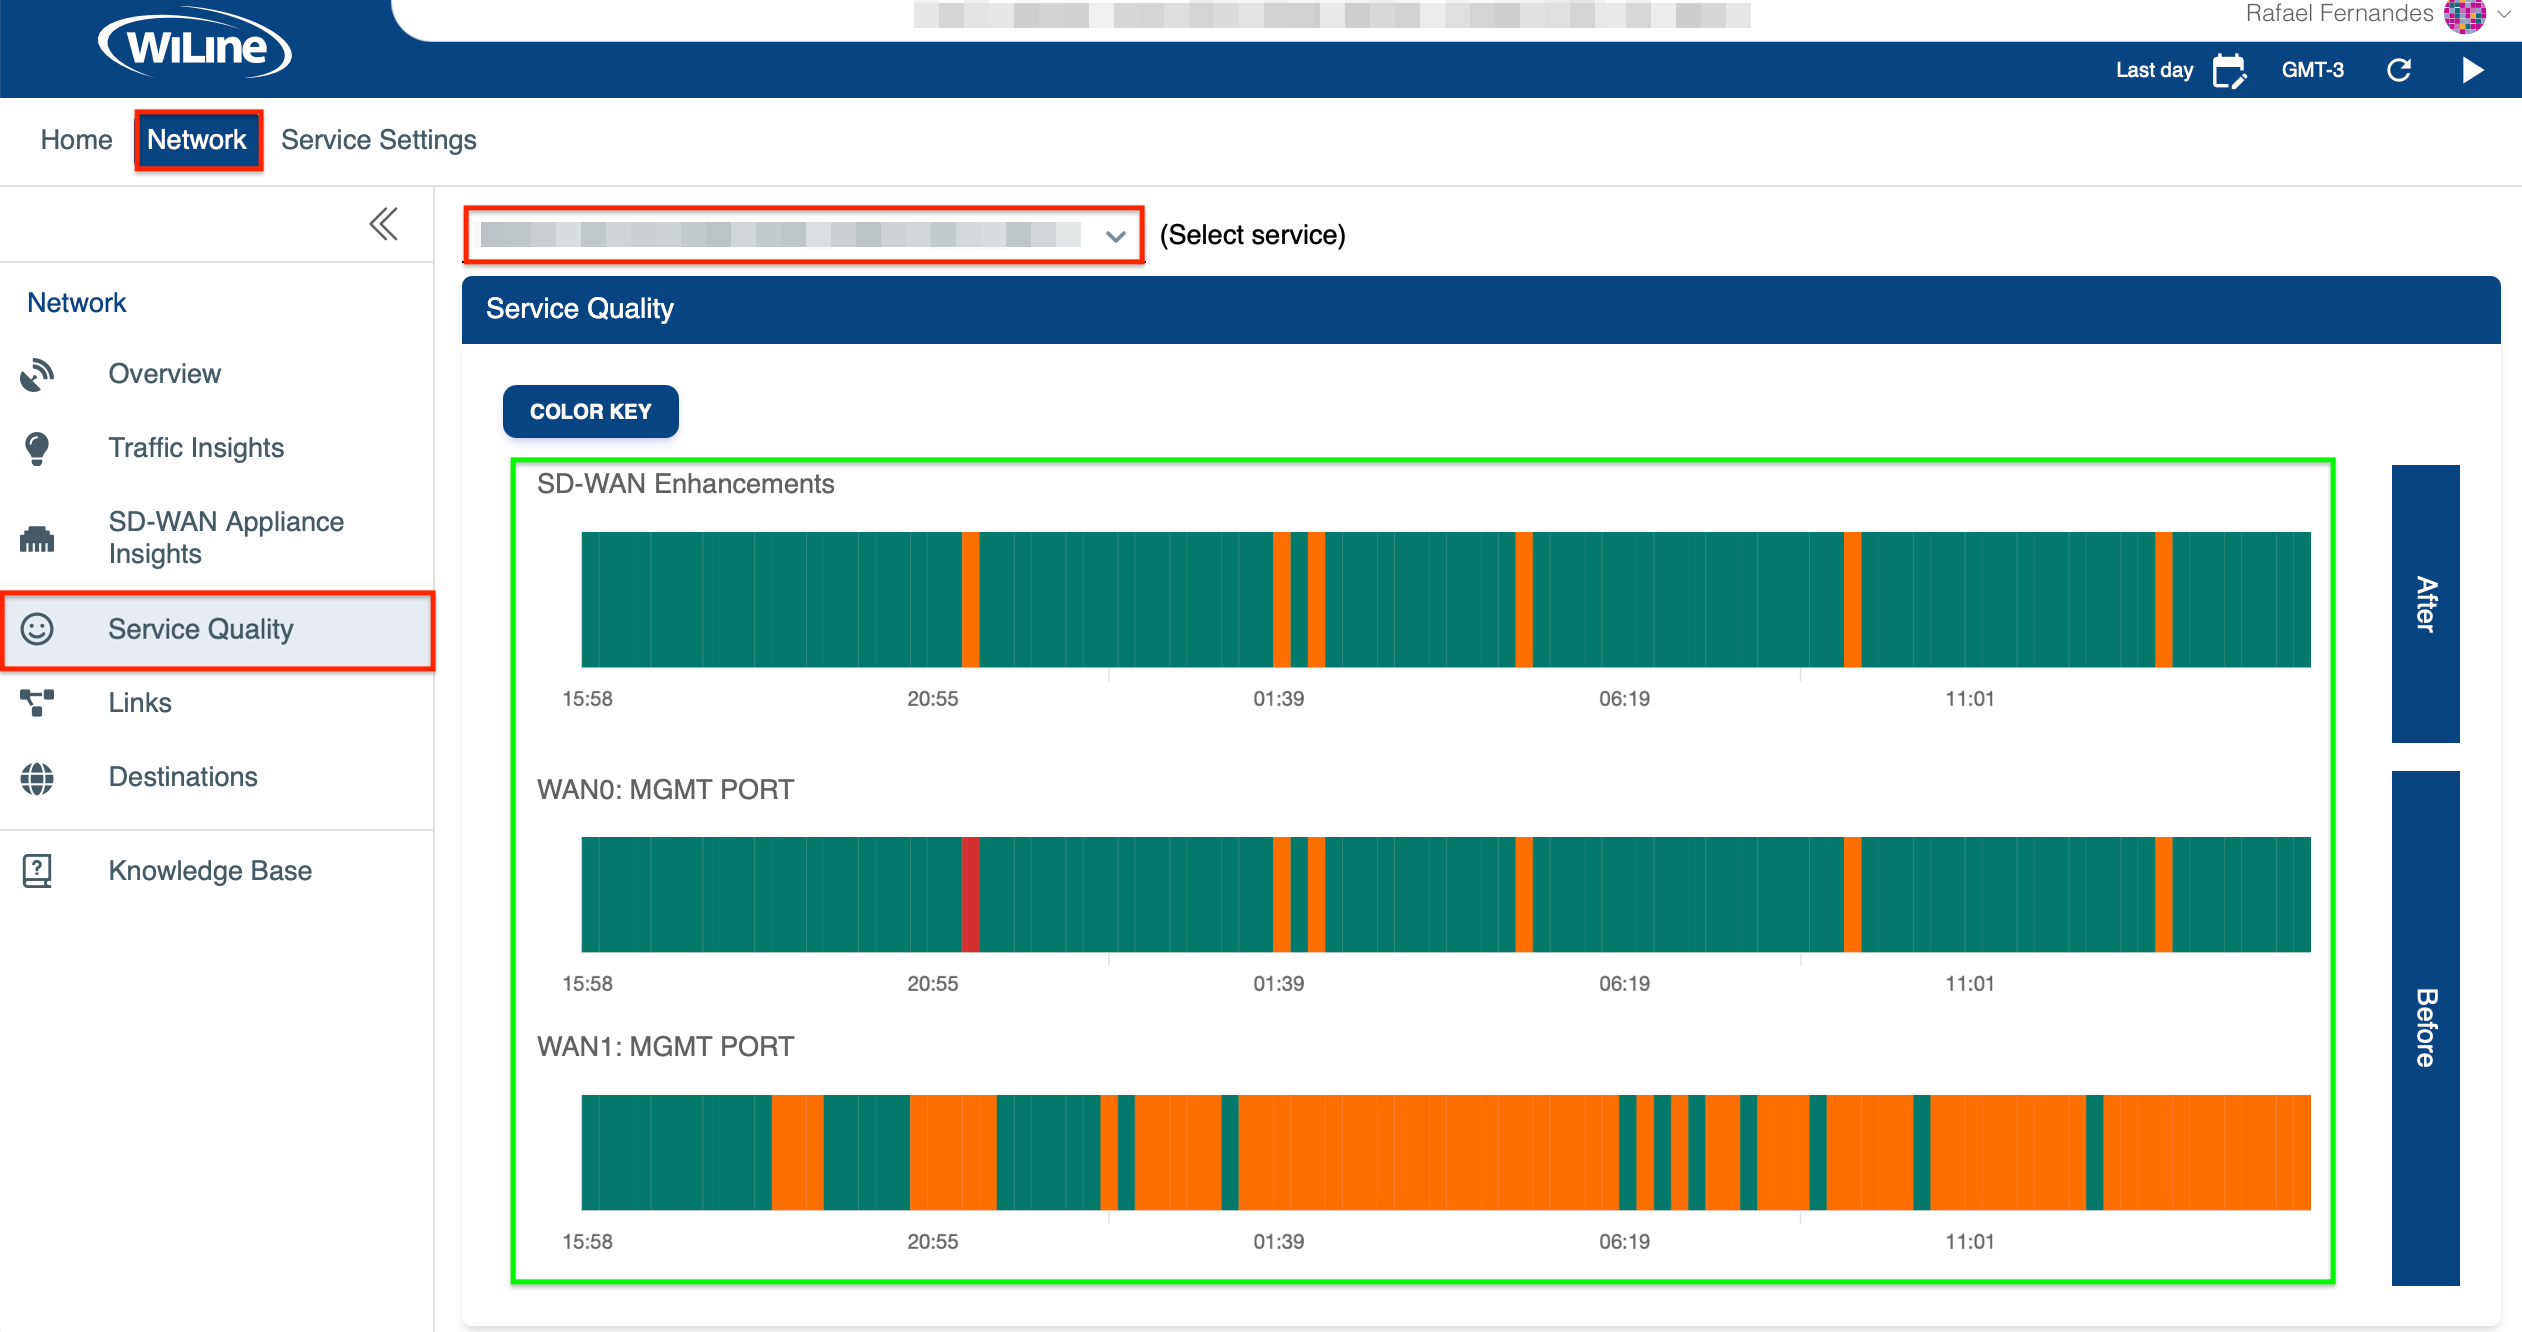
- Log in to the SD-WAN Portal.
- Navigate to Network > Service Quality.
The Service Quality graph compares network stability before and after SD-WAN deployment.
Network Performance Visualization
The Service Quality graph shows network connection quality over time:

Figure 1: Network Performance Before and After SD-WAN Implementation.
- Before: Displays network stability before SD-WAN (e.g.,
WAN0andWAN1). - After: Shows enhanced stability post-SD-WAN integration.
How SD-WAN Works
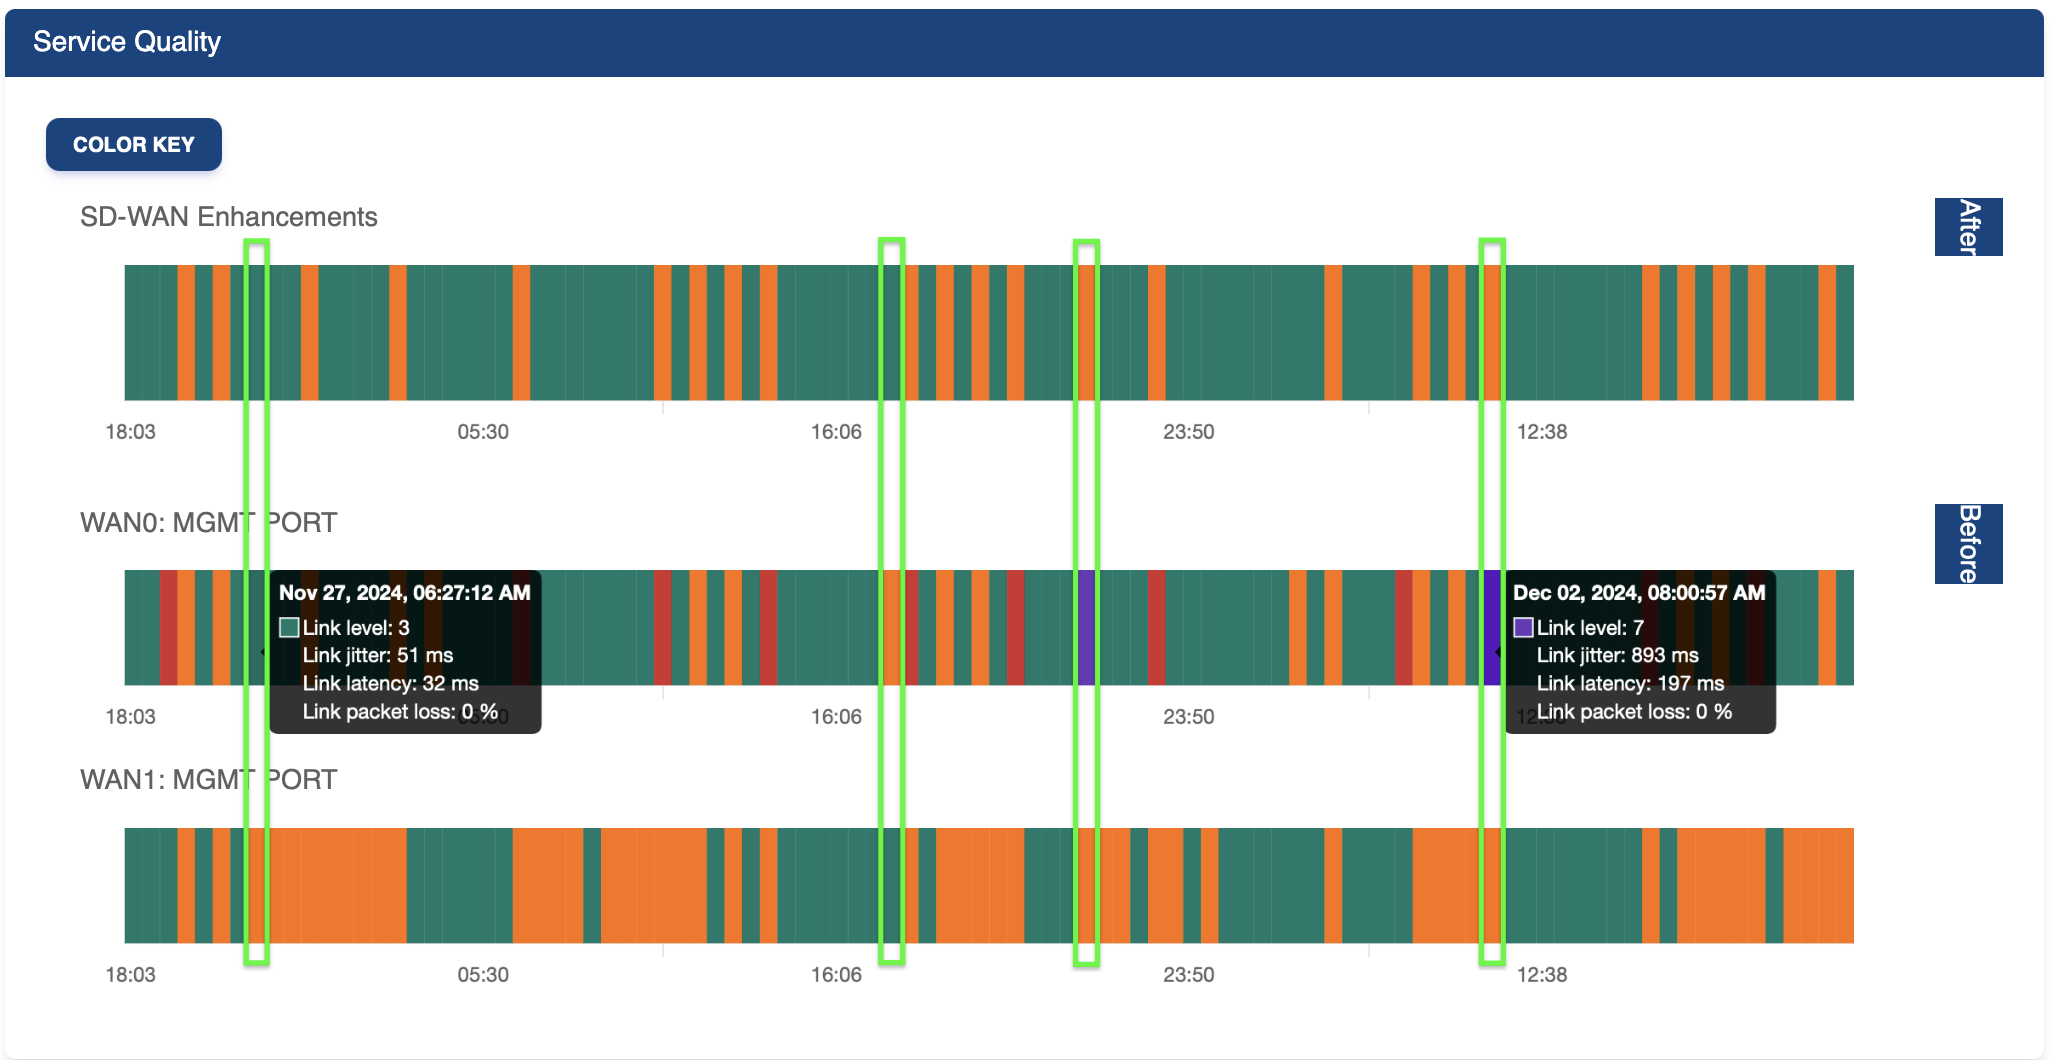
SD-WAN improves network stability by using multiple connections (e.g., WAN0 and WAN1). The SDN controller constantly monitors connection performance and reroutes traffic to the optimal path, ensuring consistent service. For example:
- Nov 27, 6:27:12 AM:
WAN1operates at Level 4, whileWAN0is at Level 1. SD-WAN prioritizes the better-performingWAN1to maintain stable service.

Figure 2: Network Performance with SD-WAN.
- By Nov 29, 06:07:12 PM,
WAN0performs at Level 4, whileWAN1remains at Level 1. The SD-WAN continues to prioritizeWAN1for strong connectivity. - On Dec 02, 08:00:57 AM,
WAN0is at Level 7, whileWAN1is at Level 4. SD-WAN ensures optimal service by routing traffic throughWAN1.
This dual-WAN setup guarantees uninterrupted service, a key benefit of SD-WAN technology.
Service Quality Circuit Levels
In the SD-WAN Portal, circuit performance is categorized into eight levels (CL1–CL8) based on key metrics like packet loss, latency, and jitter. These classifications allow users to assess the quality of their connections quickly. Below is a breakdown of the levels and their associated thresholds:
- Vibrant Teal (Level 1-3): Optimal performance with minimal issues.
- Bright Orange (Level 4-5): Moderate performance with some variability.
- Bright Violet (Level 6-7): Degraded performance due to latency or jitter.
- Crimson (Level 8): Severe degradation with significant stability issues.
- Soft Gray (N/A): Missing data; no metrics collected for that specific time range.
- Handling Missing Heartbeats:
- A missed heartbeat causes the circuit level to display as
N/A, represented as a grey block in the graph. This indicates that the service is not being logged in the system database, rather than a disruption in traffic or the circuit’s overall health.
- A missed heartbeat causes the circuit level to display as
A circuit level N/A, with grey areas, indicates a downed circuit. This differs from levels 6-7, which appear bright violet, and Level 8, which appears crimson, representing varying degrees of degraded connectivity.
This overview helps you assess connection quality at a glance. Below is the detailed table for interpreting the service levels:
| Circuit Level | 1 | 2 | 3 | 4 | 5 | 6 | 7 | 8 |
|---|---|---|---|---|---|---|---|---|
| Short Loss | 3% | 7% | 10% | 14% | 20% | 30% | 60% | 100% |
| Long Loss | 0.3% | 1% | 2% | 4% | 10% | 20% | 90% | 100% |
| Short Jitter | 35ms | 50ms | 70ms | 100ms | 400ms | 600ms | 1000ms | 1500ms |
| Long Jitter | 25ms | 40ms | 60ms | 80ms | 300ms | 500ms | 1000ms | 2000ms |
| Short Latency | 20ms | 30ms | 50ms | 100ms | 300ms | 500ms | 1000ms | 1500ms |
| Long Latency | 15ms | 25ms | 40ms | 80ms | 250ms | 500ms | 1000ms | 2000ms |
Filter Results
Refine your network data by adjusting the time zone, time range, and refresh settings:
- Time Zone: Click the Local Time icon (e.g., GMT-3) in the top-right corner to switch time zones (e.g., UTC, PST, MST).
- Time Range: Click the icon in the top-right to adjust the time period:
- Custom Dates: Choose a specific date range:
- From:
25/11/2024, 16:06 - To:
03/12/2024, 14:21
- From:
- Quick Options: Select predefined options such as
Last 15 Minutes,Last 30 Minutes,Last Hour,Last 8 Hours,Last 12 Hours.
- Custom Dates: Choose a specific date range:
- Auto Refresh: Set the refresh interval to auto-update every 10 seconds. Use the to start or the to stop.
- Preset: Click to define a custom range (e.g.,
Last 2d 5h 2m) which will be displayed asLast 2 days 5 hours 2 minutes.
- Dynamic Timing: The default refresh interval is 10 seconds, but it may extend up to 60 seconds depending on data load times and range size.
- Preset Ranges Only: Auto-refresh applies only to
Last...presets. Custom ranges are excluded, and the refresh buttons are hidden for them.
SD-WAN’s traffic control and rerouting features improve network stability and Service Quality, providing resilience and flexibility. The dual-WAN setup ensures seamless, reliable connectivity for users.