Visualize Traffic Destinations
In the SD-WAN Portal, the Destinations section provides insights into your network's traffic distribution, highlighting key metrics such as Geo-AS statistics, City-Country statistics, and destination port details.
How to Visualize Traffic Destinations
-
Log in to the SD-WAN Portal.
-
Navigate to Network > Destinations.
infoUpon entering the Destinations section, you'll find a Dashboard summarizing traffic distribution metrics. The initial view presents high-level Geo-AS statistics.
-
Use the dropdown menu in the top-left corner to select a specific service for detailed metrics, such as Destinations Geo-AS, City-Country Stats, or Top Destination Ports.
-
Below the dashboard, explore the Traffic Details Table for granular insights into traffic destinations. The table includes details such as source and destination IPs, byte counts, and packet data.
Geo-AS and City-Country Stats
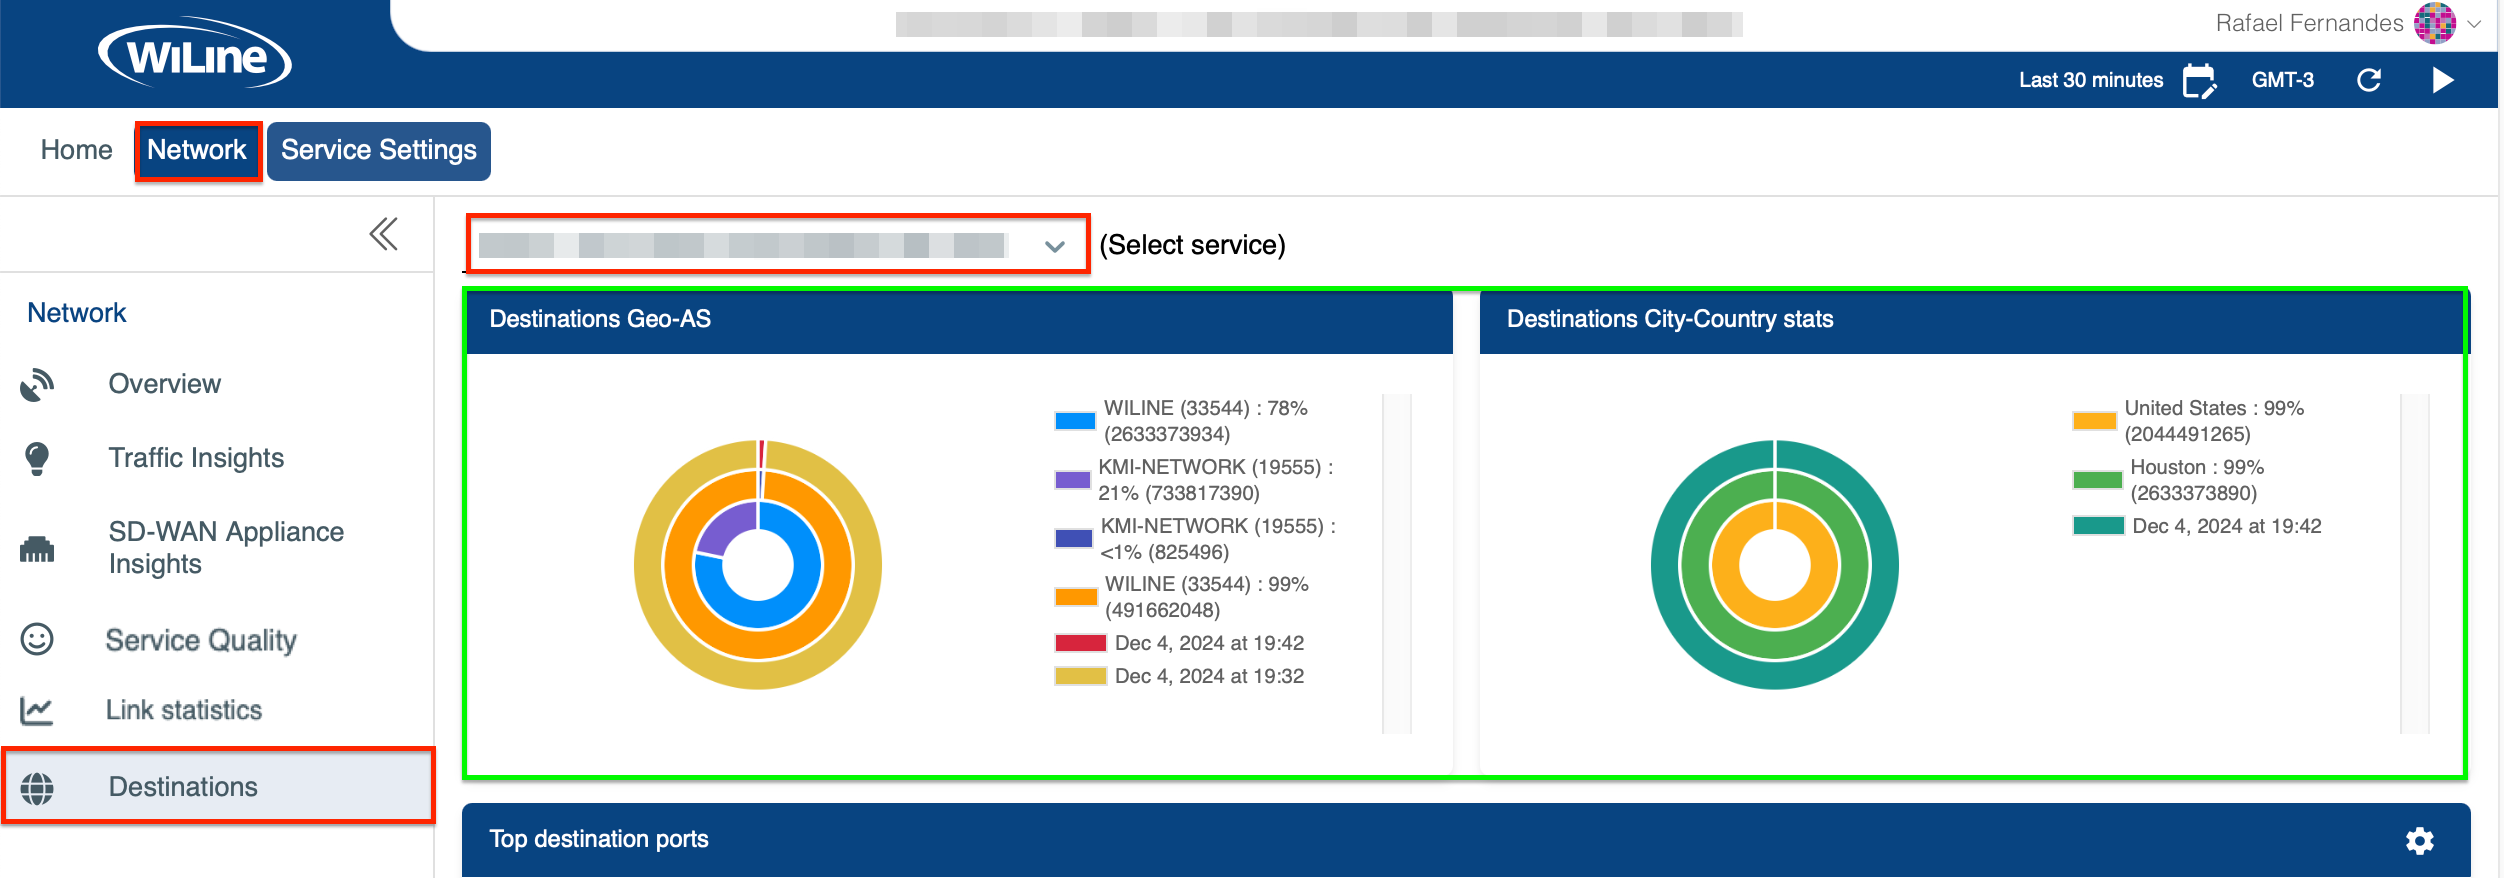
The Geo-AS section showcases traffic percentages associated with Autonomous Systems (AS), providing a breakdown of traffic by service providers or regions. The City-Country section highlights traffic distribution across geographic locations.

Figure 1: Traffic breakdown by Geo-AS and City-Country.
In Geo-AS:
- WILINE (33544) represents 78% of traffic, with 2,633,373,934 bytes sent.
- KMI-NETWORK (19555) accounts for 21% of traffic, corresponding to 733,817,390 bytes.
In City-Country:
- United States is the top destination country, handling 99% of traffic with 2,044,491,265 bytes.
- Within the U.S., Houston generates most traffic, accounting for 99% with 2,633,373,890 bytes.
Top Destination Ports
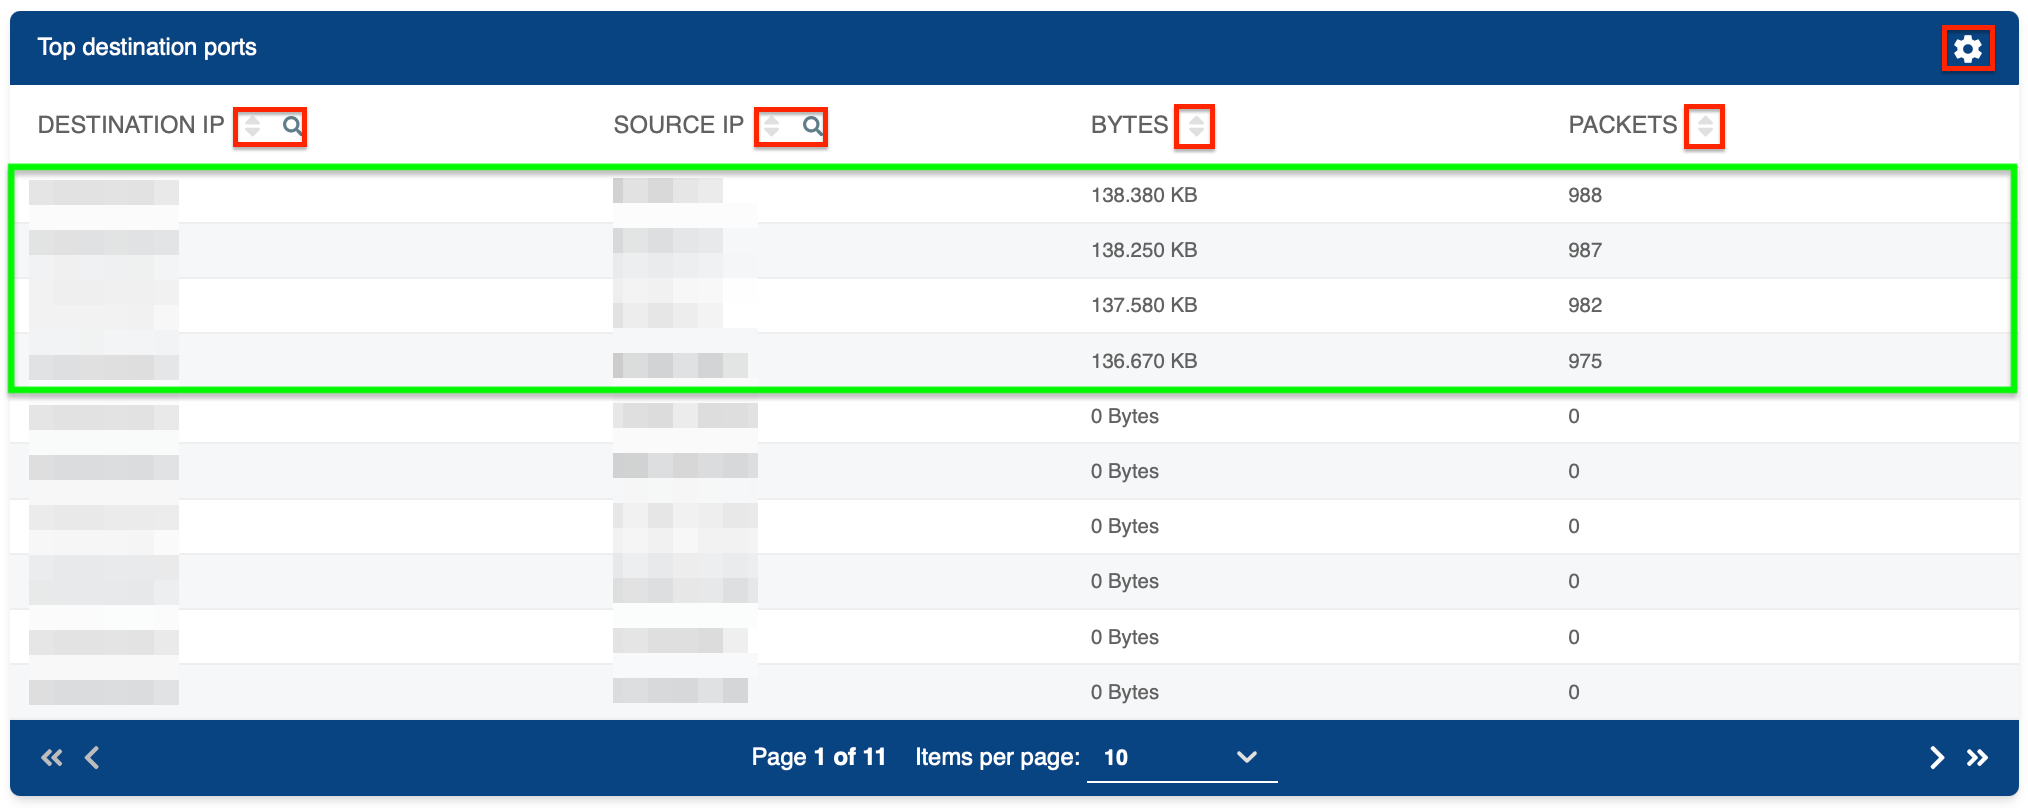
The Top Destination Ports section details traffic flow between source and destination IP addresses, including the volume of bytes and packets.

Figure 2: Example of top destination ports.
Key statistics from the example:
- The port with the most traffic handled 138.38 KB across 988 packets.
- Other significant ports had traffic ranging from 137.58 KB to 138.25 KB, with packet counts between 975 and 987.
- Several ports recorded 0 bytes and 0 packets, indicating no traffic activity.
Customizing and Filtering Data
You can filter the Traffic Details Table for granular insights into traffic destinations:
-
Search by Keywords:
- Click the (Search) icon next to the Name header to find specific items.
-
Reorganize Results:
- Click the arrows (Up) and (Down) next to the column headers to sort the data in ascending or descending order.
-
Select Columns to Display:
- Click the (Settings) icon to toggle the visibility of columns (e.g., Names, Bytes Received, Bytes Sent, etc.).
-
Time Zone and Time Range:
- Adjust the Time Zone by selecting the icon in the top-right corner to switch between options like UTC or local time.
- Customize the Time Range by choosing predefined options (e.g.,
Last 15 Minutes,Last Hour) or setting a custom range using the calendar icon.
If you don't see your filtered results right away, click the
icon in the top-right corner.By utilizing these options in the SD-WAN Portal, you can explore traffic distribution across services and destinations, gaining a comprehensive understanding of your network's performance.