Access Network Overview
In the SD-WAN Portal, you can access a comprehensive overview of your network's performance, enabling you to monitor traffic details and assess the status of your services effectively.
How to Access the Network Overview
To access the network overview:
- Log in to the SD-WAN Portal.
- Click on an expanded service item from the services table, or
- Navigate to Network > Overview, and select a service from the dropdown.
You will see a dashboard displaying detailed traffic metrics for your network.
Appliance Summary
The Appliance Summary provides an overview of the key technical details of the network appliance installed at your site. These settings ensure that your network operates seamlessly and stays connected to the internet.
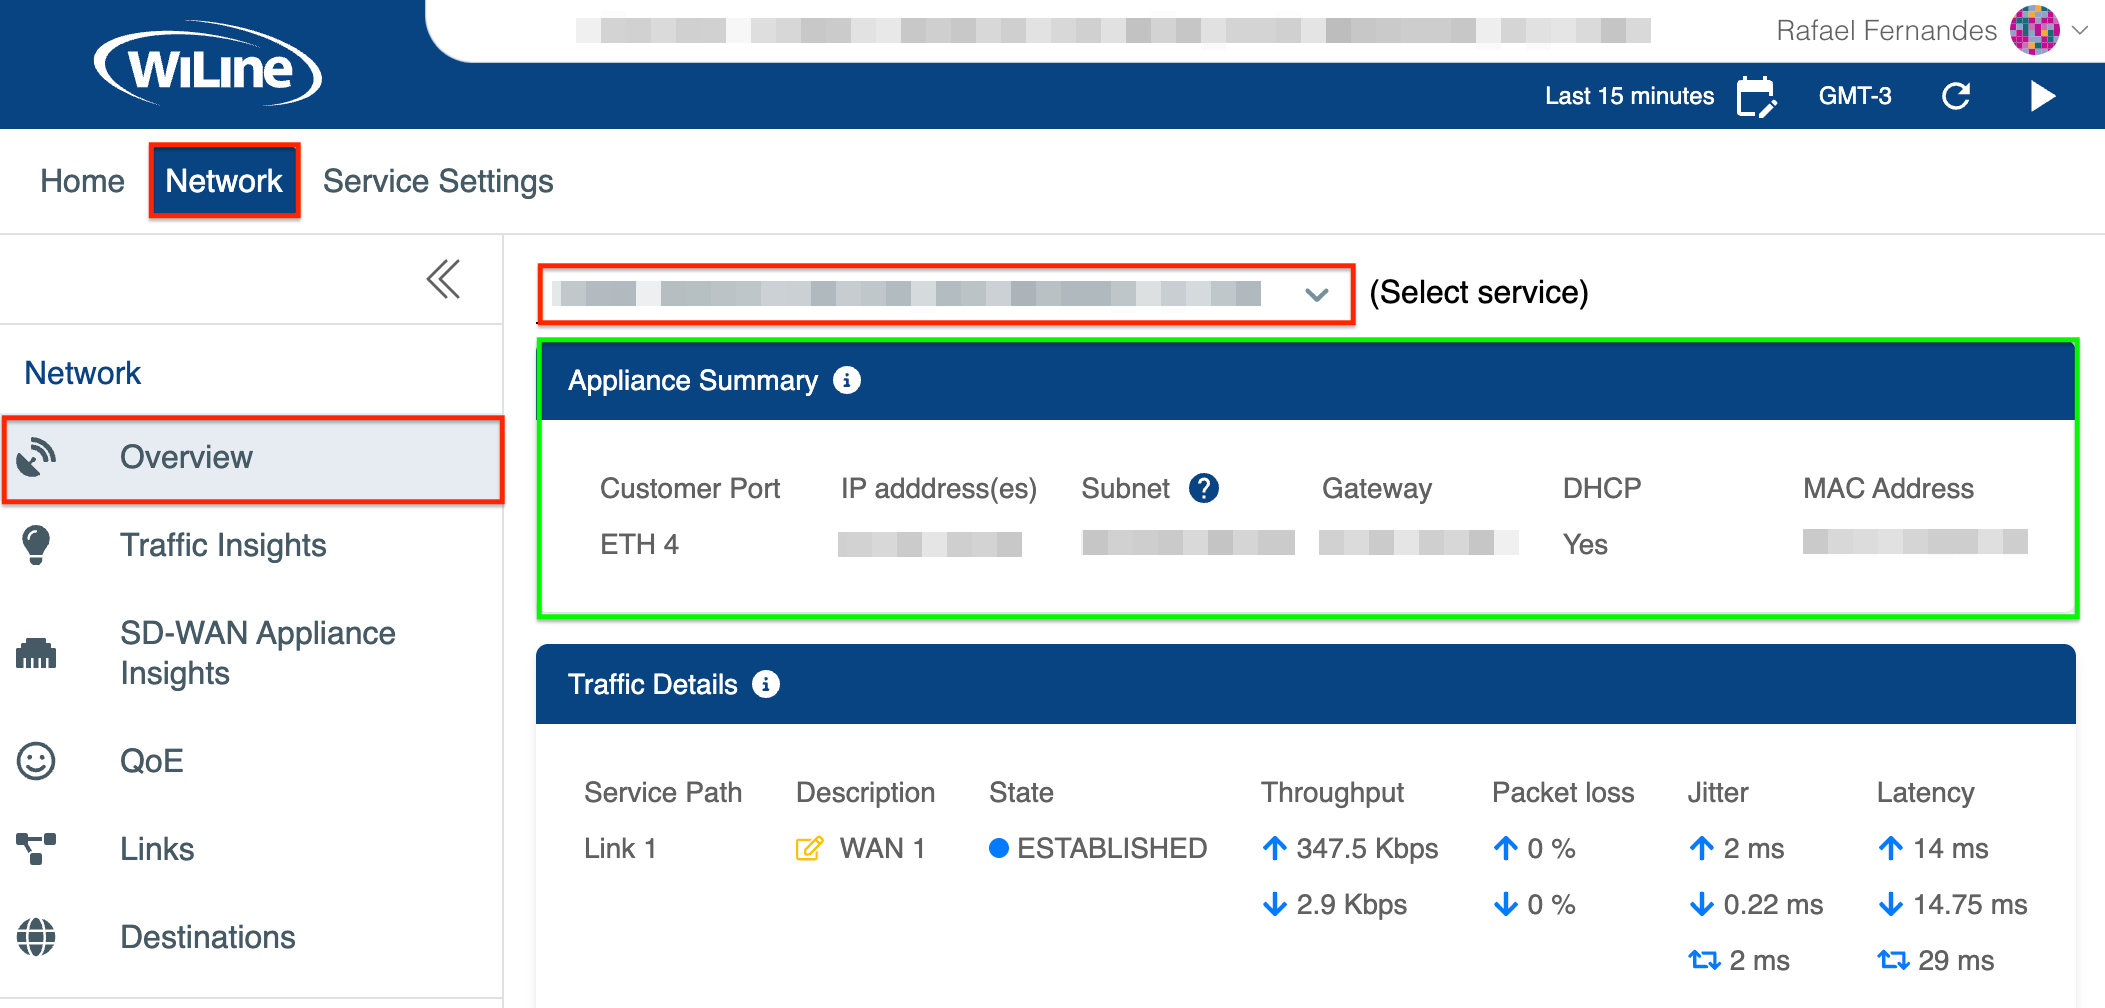
Figure 1: Exploring the Appliance Summary.
Below are the details and their explanations:
-
Customer Port:
This is the physical Ethernet port on the appliance that connects to your local network or devices. In this setup, ETH 4 is the active port used to provide network access. -
IP Address(es):
The unique public IP address assigned to your network by the service provider. This address typically looks likeXX.XXX.XXX.XXand allows your network to communicate with external systems on the internet. -
Subnet:
The subnet defines how many devices can operate within your network. For example, a subnet might look like255.XXX.XXX.XXX, which limits the network to two usable IPs—one for the appliance and one for the gateway. -
Gateway:
The gateway is like your network’s “exit point” to the internet, routing traffic between your devices and external systems. It is typically represented as an IP address that will look like this67.XXX.XXX.XX.Subnet and Gateway UsageIf your subnet does not match the number of available hosts, it’s because the subnet is configured locally on the appliance to manage your connection. Usable IPs are shared with our core network as individual
/32addresses, optimizing IP usage and improving connection security. This ensures your gateway IP functions locally but is not accessible externally, aligning with standard networking practices. -
DHCP:
Indicates whether the appliance is set to dynamically assign IP addresses to connected devices. In this configuration, DHCP is enabled, meaning devices on your network will automatically receive an IP address. -
MAC Address:
A unique identifier for the appliance’s customer-facing port. This address helps the appliance communicate within your network. Typically, it looks something like20:7c:14:xx:xx:xx.
This information is crucial for ensuring seamless integration with your network infrastructure.
If this section is not visible in your portal, it may be because the device at your location is configured to Managed Router Mode. In this mode, we serve as the router for your location, assigning private RFC1918 addresses to your network.
Traffic Details
The Traffic Details section provides an overview of circuits, their associated service paths, and descriptions, allowing users to understand their network setup and connections.
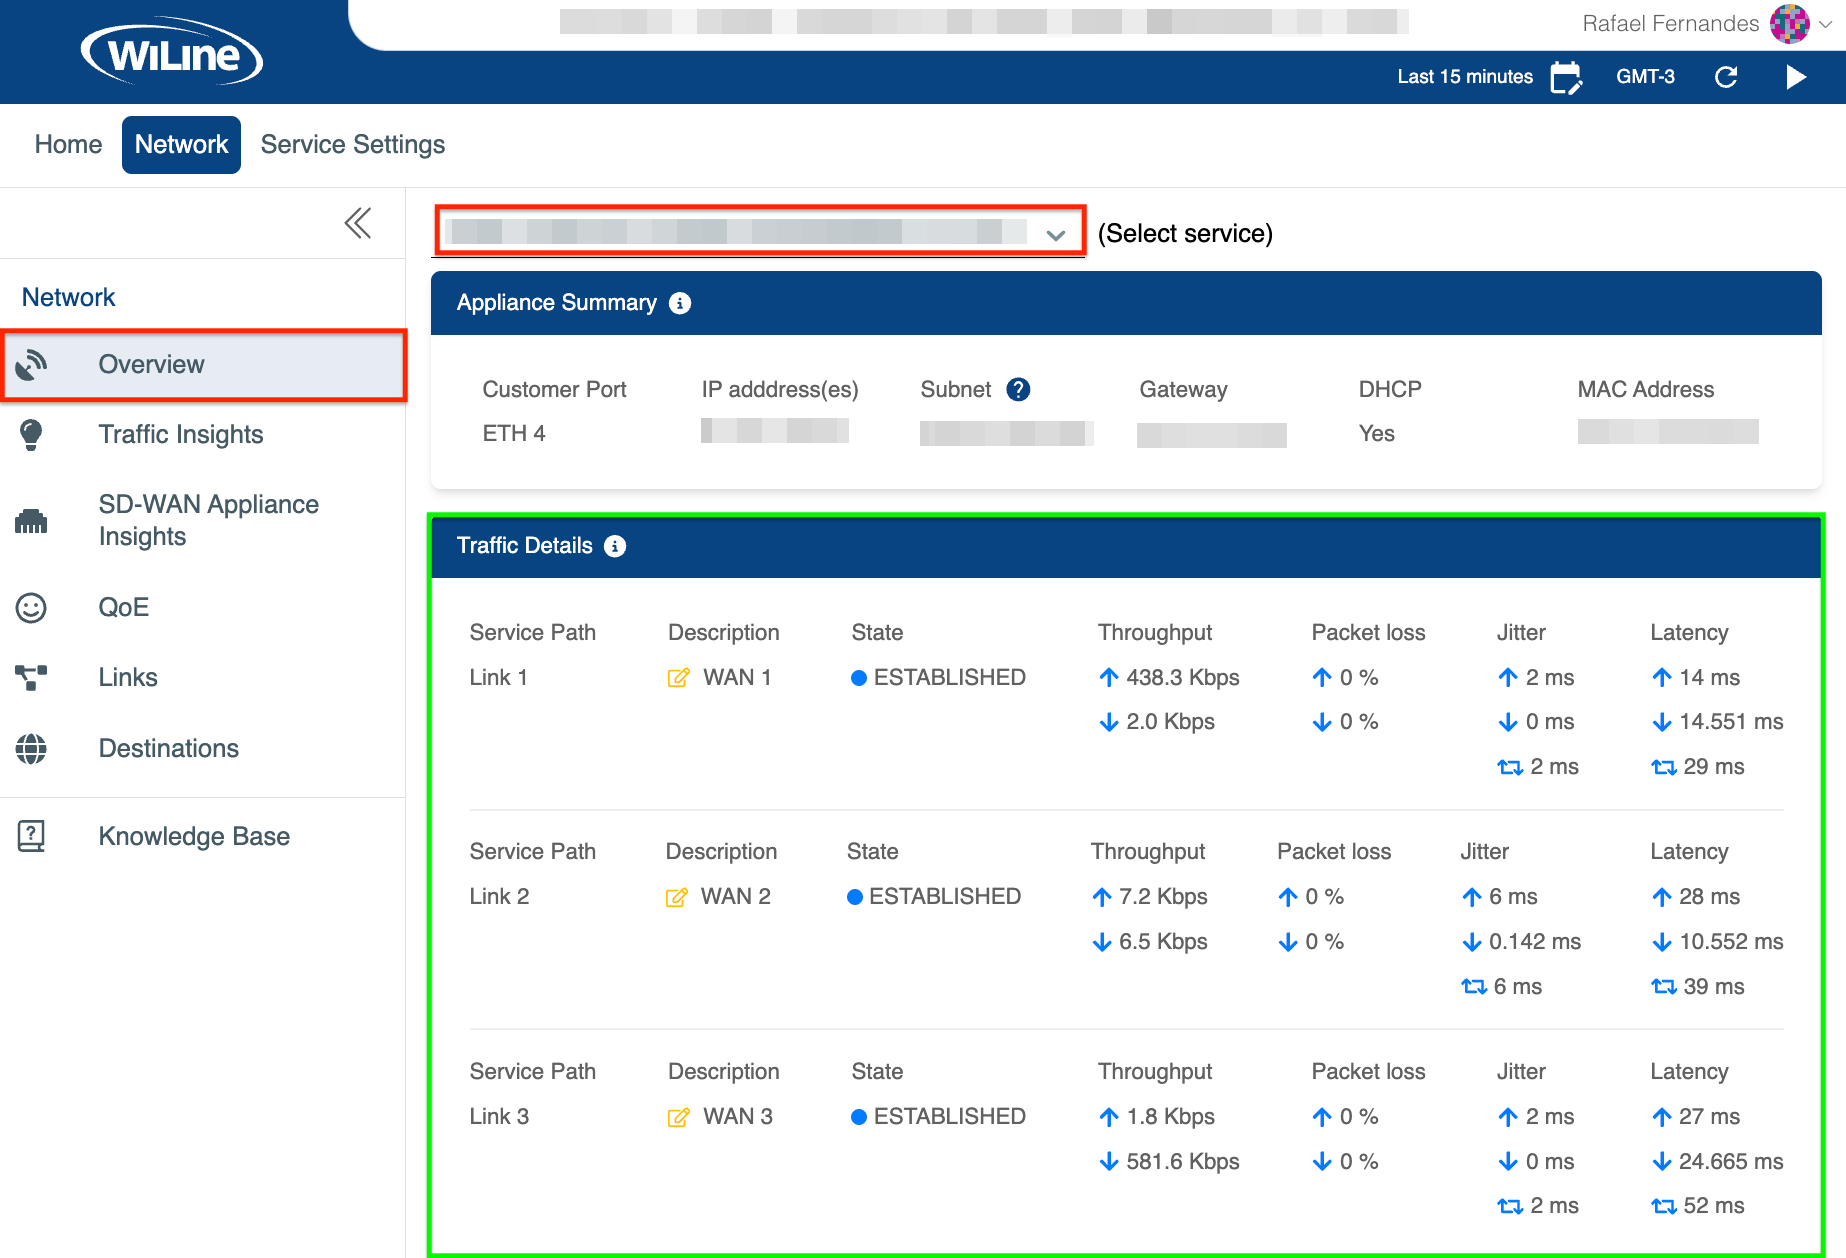
Figure 1: Exploring the Traffic Details.
Service Path Overview
This section introduces the Service Path, which corresponds to specific WAN link configurations in the network. The information is organized as follows:
-
Service Path: Link 1
- Description: WAN 1
- Details: The primary WAN link for service delivery. Clicking on the icon next to "WAN 1" allows the user to input the port description (e.g.,
eth0).
-
Service Path: Link 2
- Description: WAN 2
- Details: Secondary WAN link for redundancy or additional services. The configuration dialog allows users to input the port description (e.g.,
eth1).
-
Additional Links
- For setups with more links (e.g., Link 3, Link 4), corresponding descriptions (e.g., WAN 3, WAN 4) and details can be managed similarly.
To improve usability, technical terms like "management port" and Ethernet references (e.g., eth0, eth1) have been replaced with intuitive labels such as WAN 1 and WAN 2, simplifying configuration and enhancing user understanding.
Other Metrics
-
State: Displays the circuit's status. A ESTABLISHED status indicates the circuit is active and all configured features are functioning normally.
noteThe system periodically monitors tunnel health and data flow. If no data is detected, the circuit transitions to the RETRY state, where the system attempts to restore connectivity based on prior conditions.
-
Throughput: Measures the data transfer rate over the circuit:
- Up (e.g., 333.9 Kbps) refers to data sent from your device to the network (e.g., sending emails, uploading files).
- Down (e.g., 406.2 Kbps) refers to data received from the network (e.g., downloading files, streaming videos).
-
Packet Loss: Indicates the percentage of lost packets during transmission, where 0% reflects perfect performance. For optimal results, packet loss should not exceed 1%.
-
Jitter: Reflects the variability in packet arrival times, indicating data delivery consistency. Lower jitter values (below 30 ms) are best. For example:
- 3 ms indicates low variability, which is ideal for real-time applications.
- 1.25 ms signifies near-perfect consistency.
- 5 ms suggests some variability but is still within an acceptable range.
-
Latency: Measures the delay in packet transmission, indicating connection responsiveness. Latency shouldn't exceed 150 ms one-way or 300 ms round trip for efficient communication:
- 36 ms shows the time taken for data to travel from your device to the network.
- 46.049 ms represents the time for data to return from the network to your device.
- 82 ms indicates the total round-trip time, which is within acceptable limits.
This information helps you quickly assess network performance and identify any potential issues.
This data is live and reflects the most recent information available. The date range is not applied; only the refresh interval is considered for retrieving the latest data.
Filter Results
Customize your network data by adjusting the time zone, time range, and refresh rate:
-
Time Zone: Click the Local Time icon (e.g., GMT-3) in the top-right corner to change the time zone (e.g., UTC, PST, MST).
-
Time Range: Click the
icon on the top-right to set the time range:- Customize Dates: Specify a custom range:
- From:
25/11/2024, 16:06 - To:
03/12/2024, 14:21
- From:
- Quick Ranges: Choose from options like
Last 15 Minutes,Last 30 Minutes,Last Hour,Last 8 Hours,Last 12 Hours.
- Customize Dates: Specify a custom range:
-
Preset: Click to define a custom range (days, hours, minutes). E.g.,
Last 2d 5h 2mwill be displayed asLast 2 days 5 hours 2 minutes. -
Auto-refresh: Set the refresh interval to update automatically every 10 seconds. Use the
to start or the to stop the refresh.
- Dynamic Timing: The default refresh interval is 10 seconds, but it may extend up to 60 seconds depending on data load times and range size.
- Preset Ranges Only: Auto-refresh applies only to
Last...presets. Custom ranges are excluded, and the refresh buttons are hidden for them.
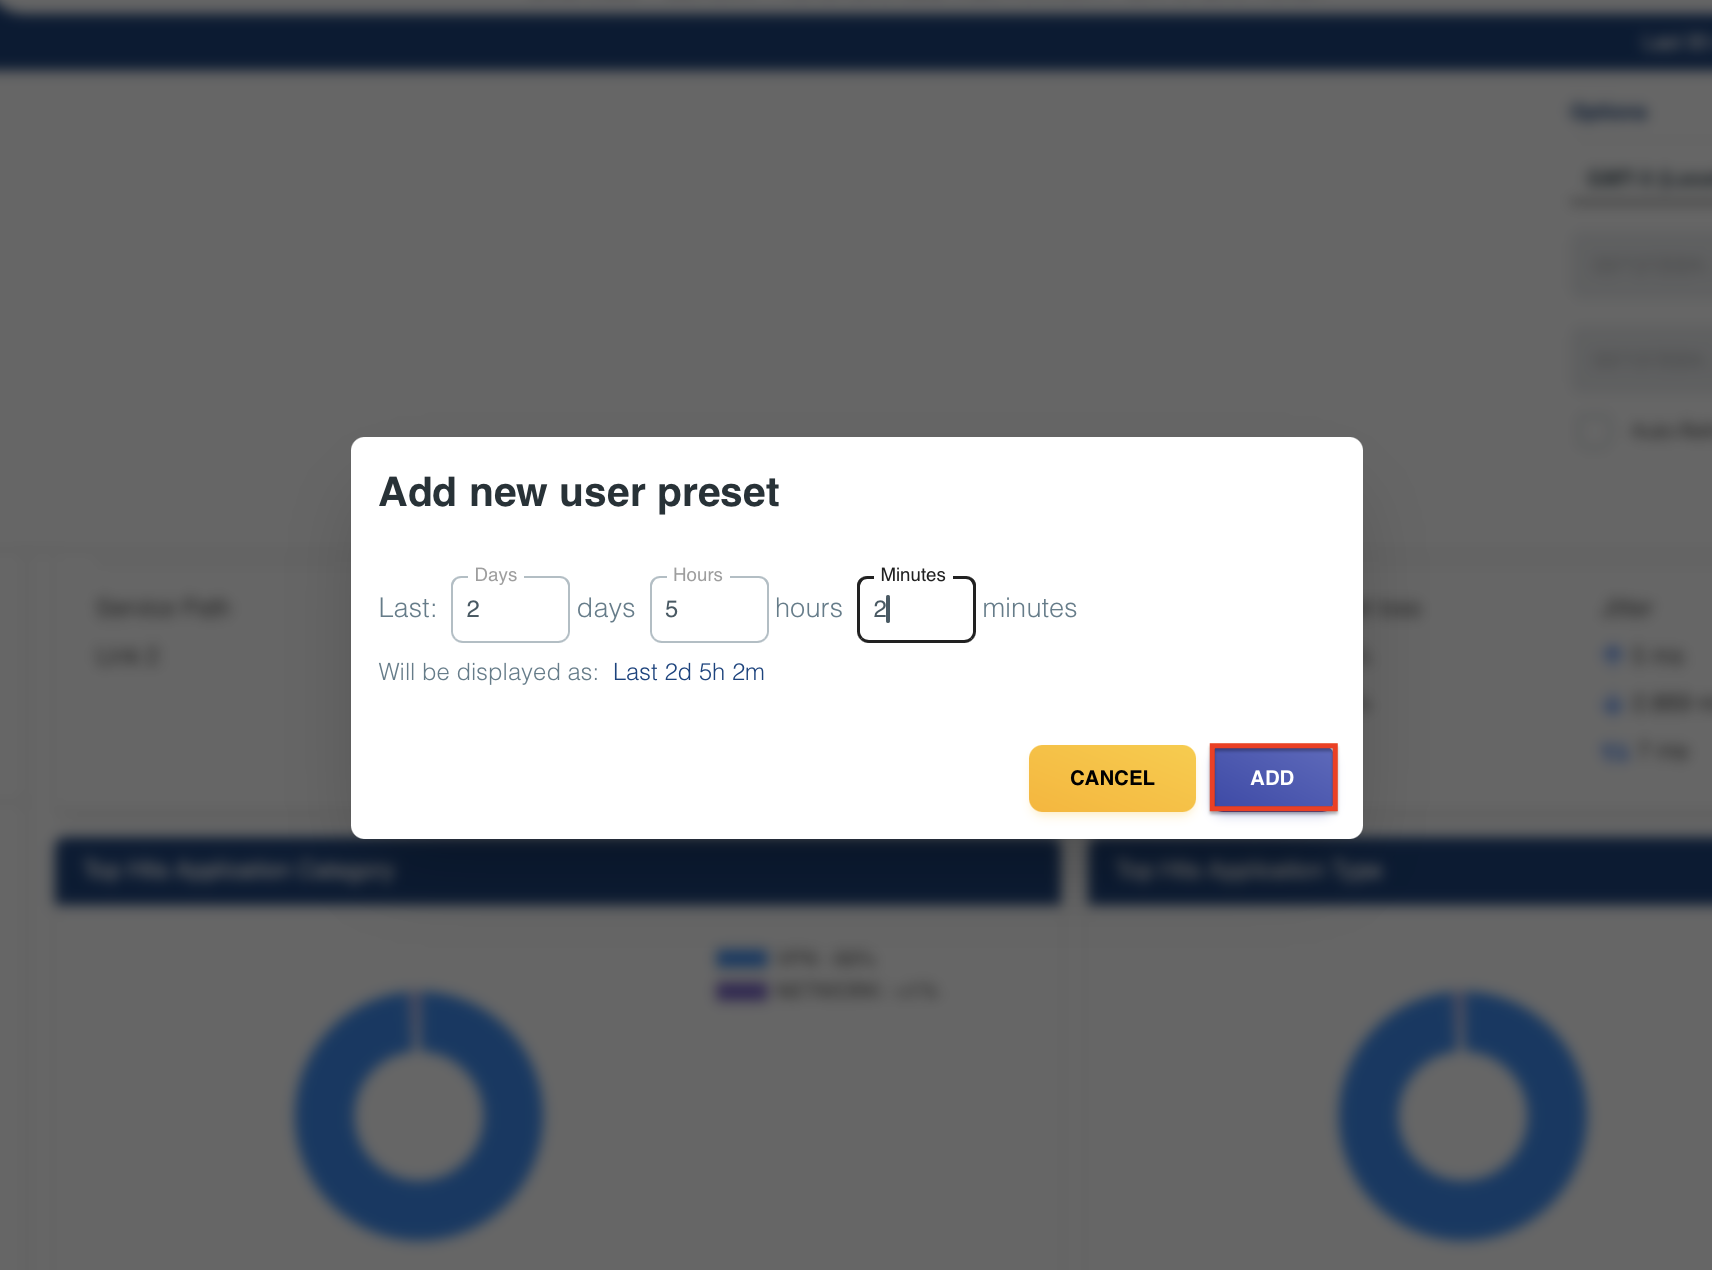
Figure 1: Defining a Preset.
Top Applications
This section provides an overview of the most frequently used applications, represented through graphical and tabular data for easier visualization.
Top Applications by Usage
The first graph displays the distribution of network usage across different applications:

Figure 2: Illustrates the usage distribution of top applications by category and type.
As seen in Figure 2, the VPN accounts for 99% of network traffic. A VPN (Virtual Private Network) allows secure, encrypted connections over the internet, often used for remote access to internal networks. Other applications, such as WEB, SYSTEM_OS, and DOWNLOAD, contribute less than 1%, highlighting their minimal impact on the network.
The second graph focuses on application types based on the number of hits. Similar to network usage, IPSEC (99%) dominates the hits. IPSEC (Internet Protocol Security) is a protocol used for encrypting and authenticating communications, crucial for secure internet data transfers. Other types like TELNET, IP_ICMP, DNS, and BITTORRENT show negligible traffic.
Tabular Summary
Detailed numerical data corresponding to the usage and hit counts for each application type and category can be accessed as well:
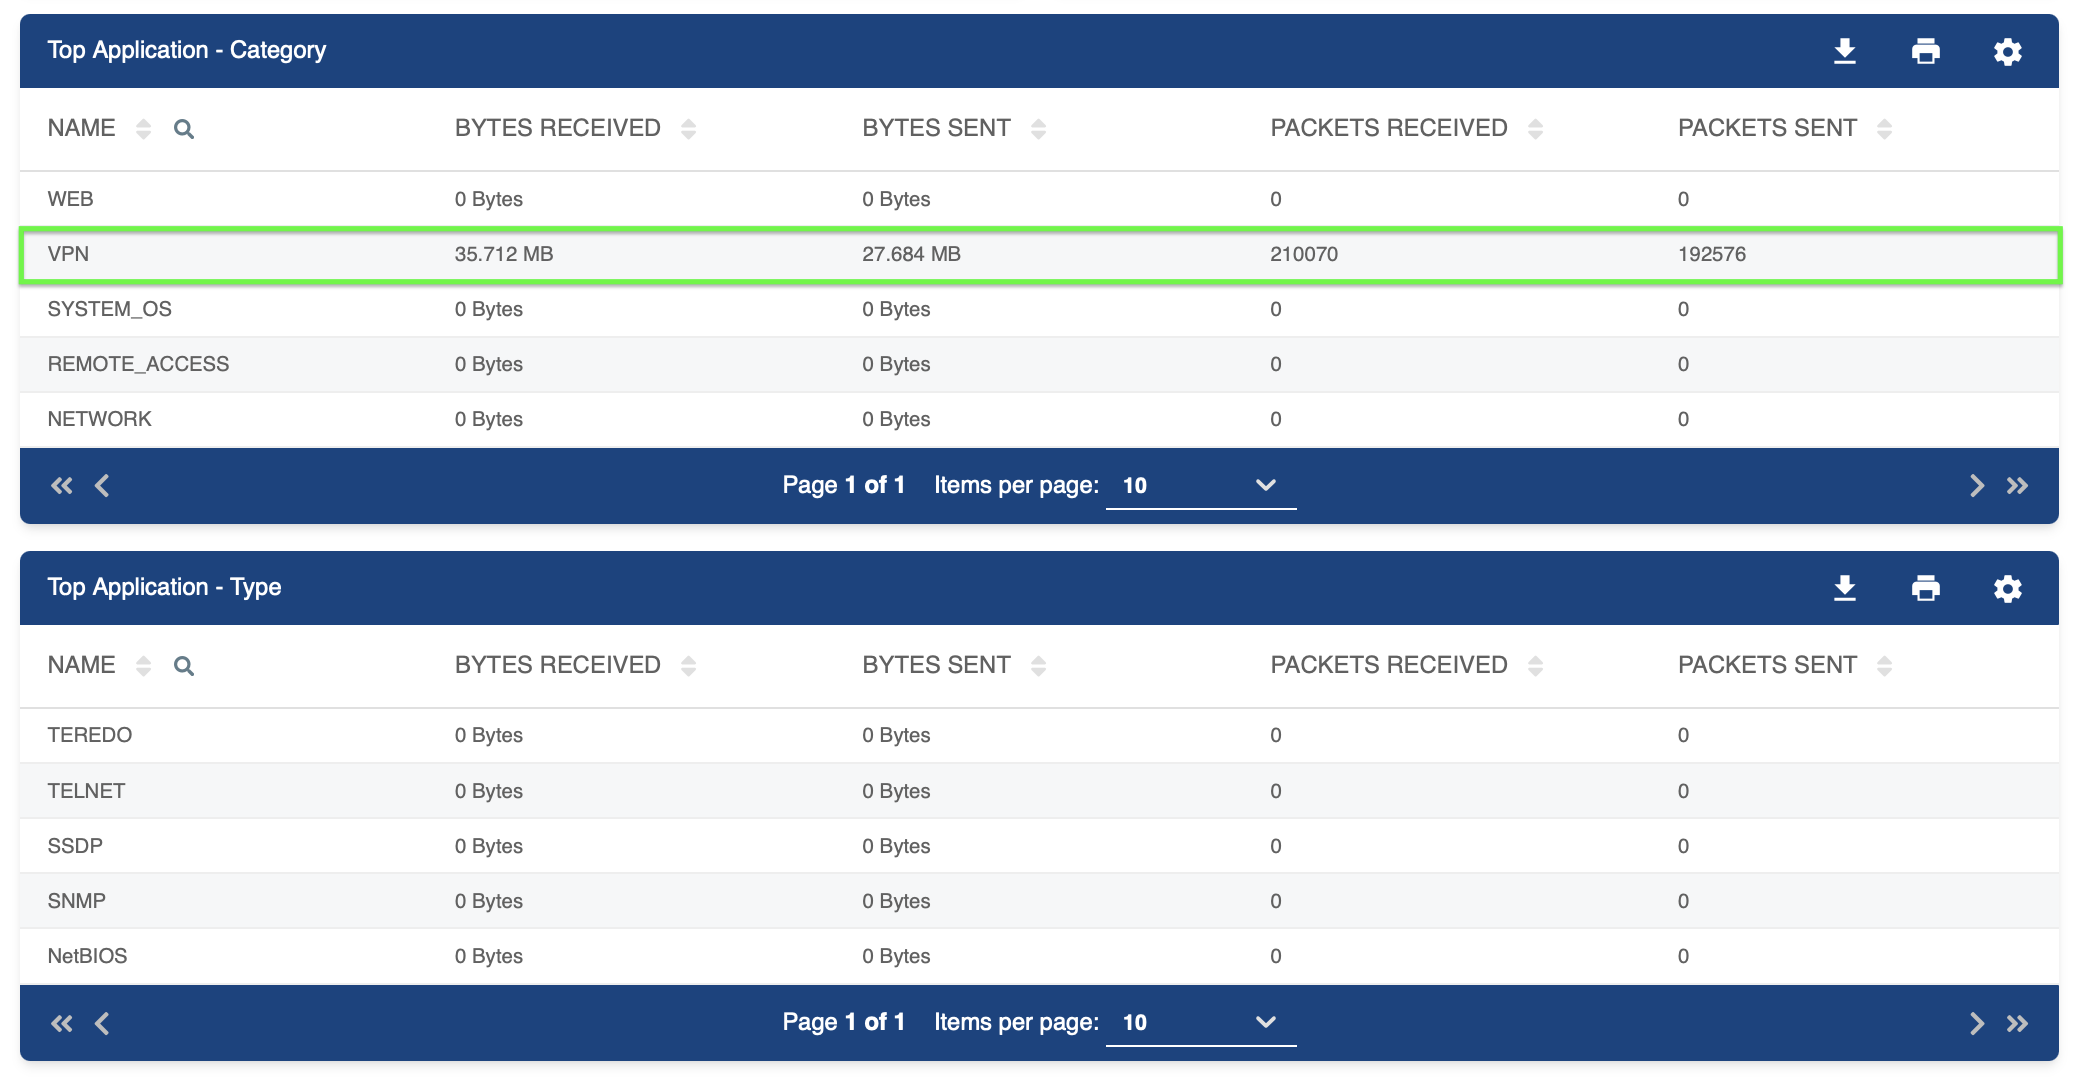
Figure 3: Numerical details of top applications' usage distribution.
As seen in Figure 3, the first tables illustrates the dominance of VPN as the most utilized application, with all others contributing minimally.
Filter and Customize Results
Similar to the Overview section, you can filter and customize the table view as follows:
-
Filter by Keywords:
- Use the (Search) icon next to the Name header to serch for specifi items.
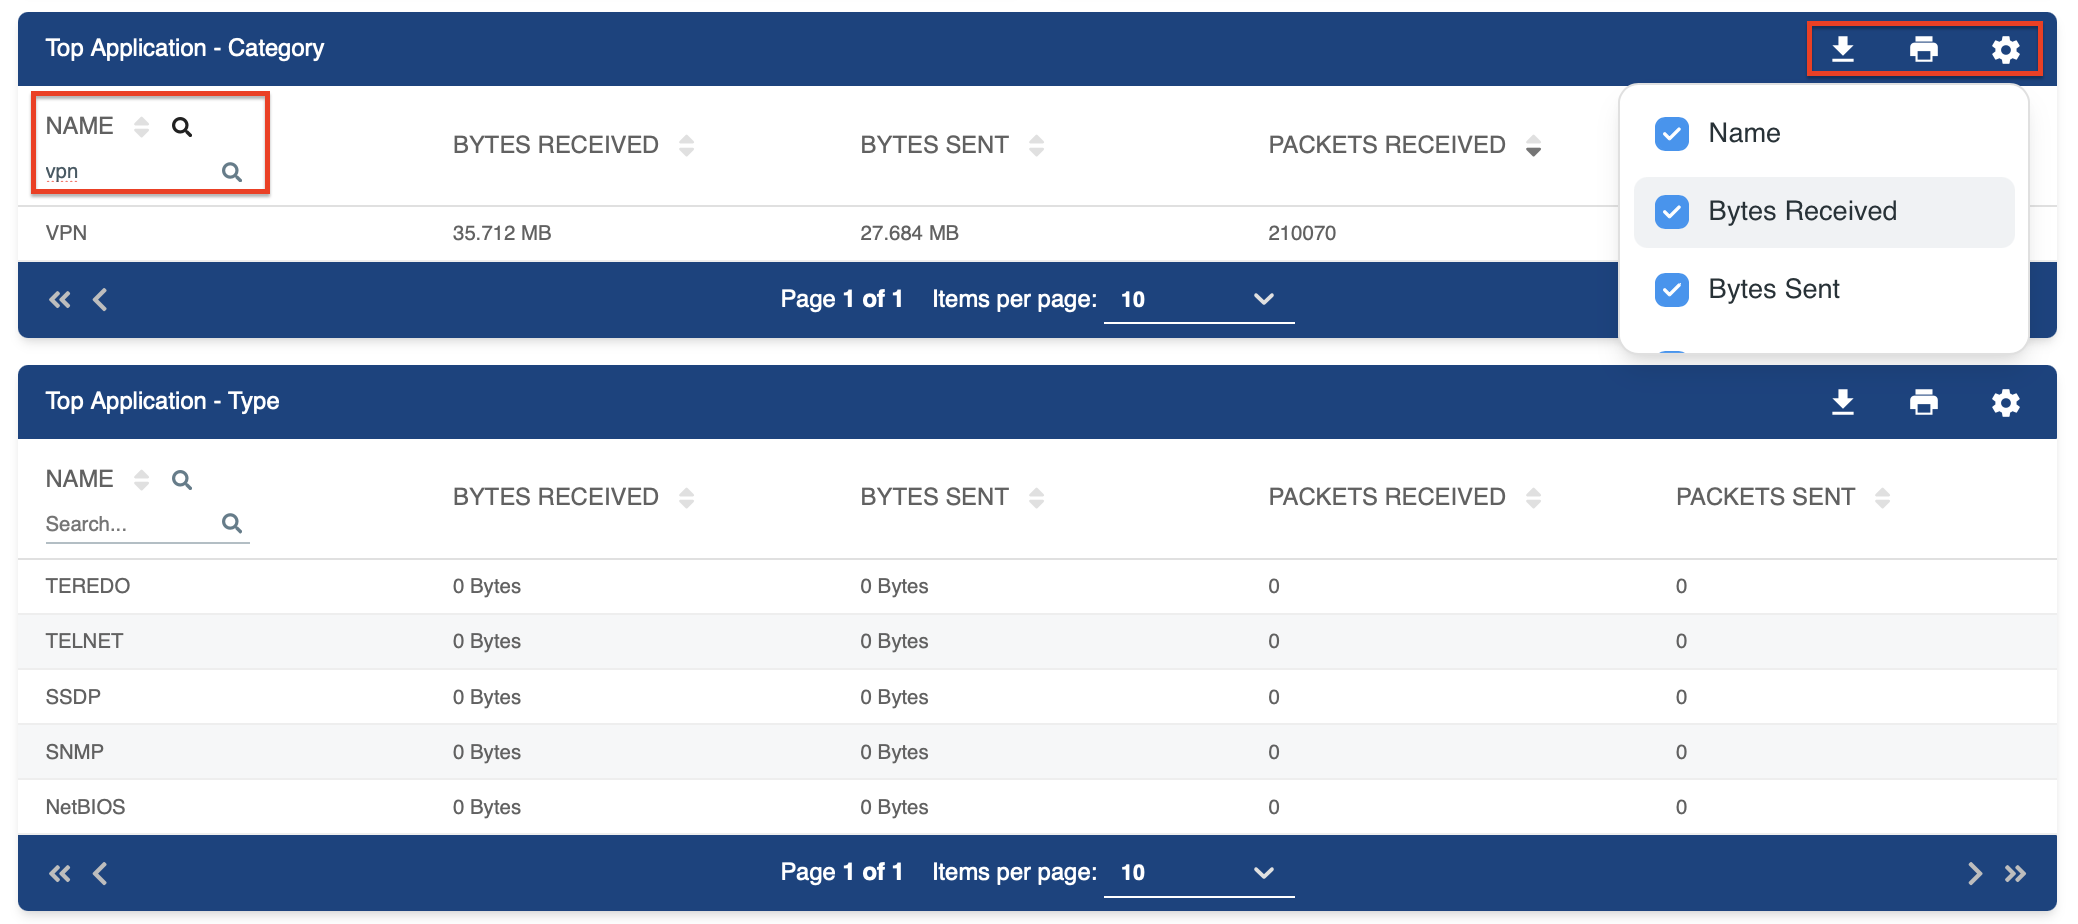
Figure 4: Filtering the Top Apps Tables -
Choose Columns to Display:
- Click the (Settings) icon to deselect columns you want to hide.
-
Download Data:
- Click the (Download) to export the selected data to a .CSV file.
-
Print Table:
- Click the (Print) to print the table with the results.
These tools allow you to sort and filter data to suit your specific needs.
Refresh Results
If you don't see your filtered results right away, click the
icon in the top-right corner.By utilizing the Network Overview in the SD-WAN Portal, you can effectively monitor your network's health and performance, facilitating proactive management and quick issue resolution.