View Link Statistics
In the SD-WAN Portal, the Links section highlights key metrics such as average throughput, round-trip delay, jitter, and packet loss, providing a comprehensive view of network performance over time.
How to Monitor Link Statistics
-
Log in to the SD-WAN Portal.
-
Navigate to Network > Link Statistics.
noteUpon entering the Links section, you'll find a dashboard that explores various performance metrics. The initial view presents the Average Throughput.
-
To switch between different metric types, select a new option (e.g., Bytes Received/Sent, RTT (Round Trip Time), Packets Received/Sent, Jitter, etc.) from the dropdown in the top left corner below the sidebar.
Average Throughput
The Average Throughput graph displays the data rate over time, providing insights into your circuit's capacity utilization. You can visualize the average throughput over different periods.
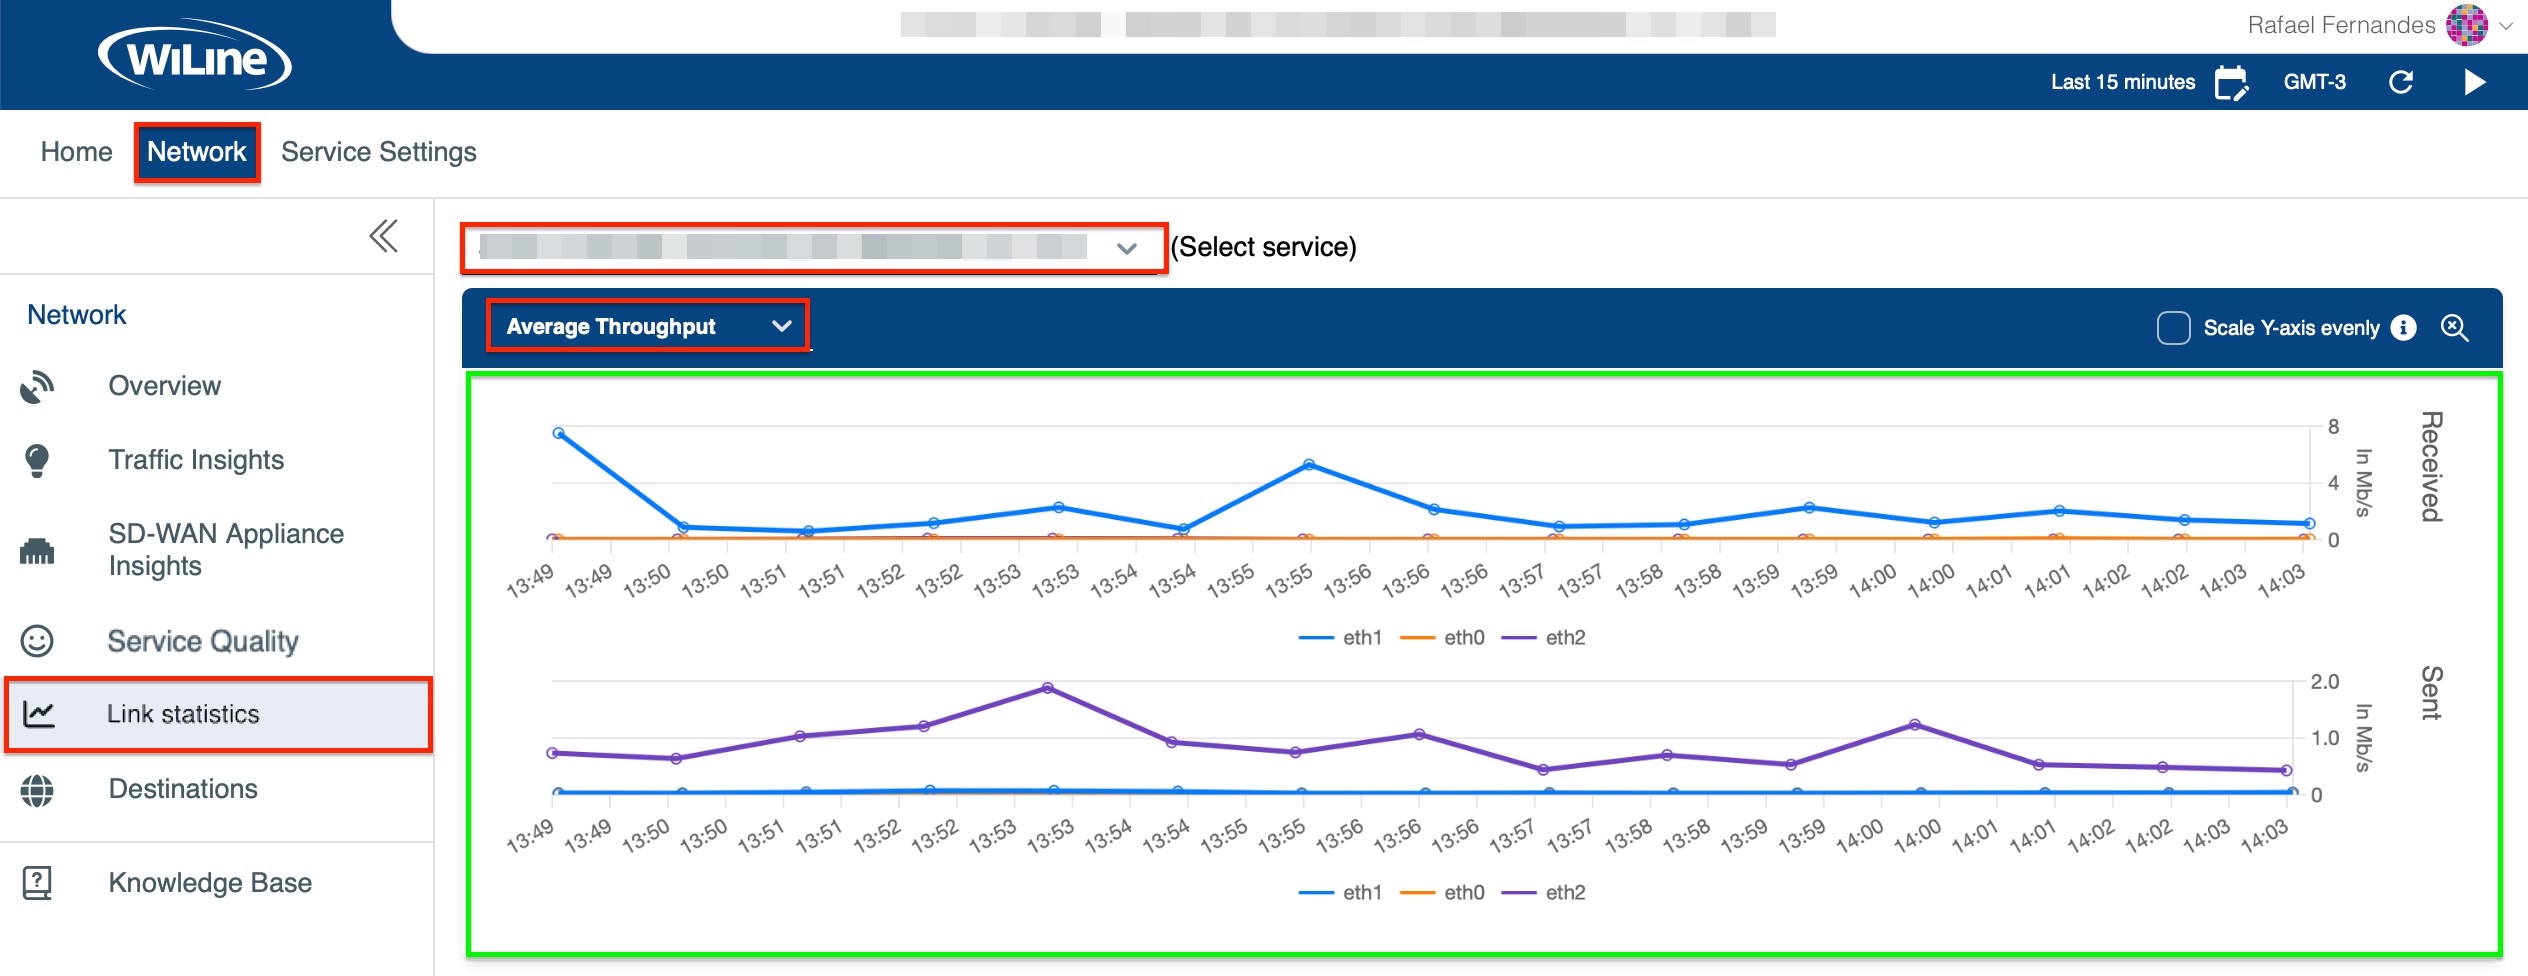 Figure 1: Average Throughput over the last 15 minutes (GMT-3).
Customizing and Filtering Data
Refine how network data is displayed using the following controls:
- Time Zone: Click the Local Time icon (e.g., GMT-3) in the top-right corner to switch to a different time zone (e.g., UTC, PST, MST).
- Time Range: Use the icon to set a specific time range or select predefined options like
Last 15 Minutes,Last 30 Minutes,Last Hour, etc. - Preset: Define a custom time range, such as
Last 2d 5h 2m, representing the last 2 days, 5 hours, and 2 minutes. - Auto Refresh: Enable automatic updates every 10 seconds by clicking to start or to stop refreshing.
- Dynamic Timing: The default refresh interval is 10 seconds, but it may extend up to 60 seconds depending on data load times and range size.
- Preset Ranges Only: Auto-refresh applies only to
Last...presets. Custom ranges are excluded, and the refresh buttons are hidden for them.
These options help you sort and customize data to suit your needs.
If you don't see your filtered results right away, click the
icon in the top-right corner.In addition to throughput, several other critical circuit metrics can be examined.
RTT/ULL
The RTT graph illustrates the round trip time for packets, providing insights into the latency experienced in the circuit. A lower RTT indicates better network performance.
ULL (Ultra Low Latency) indicates the performance of the network when the latency is extremely low, usually necessary for real-time applications or services that require minimal delay.
To monitor RTT/ULL, simply select RTT/ULL from the dropdown in the top left below the sidebar:
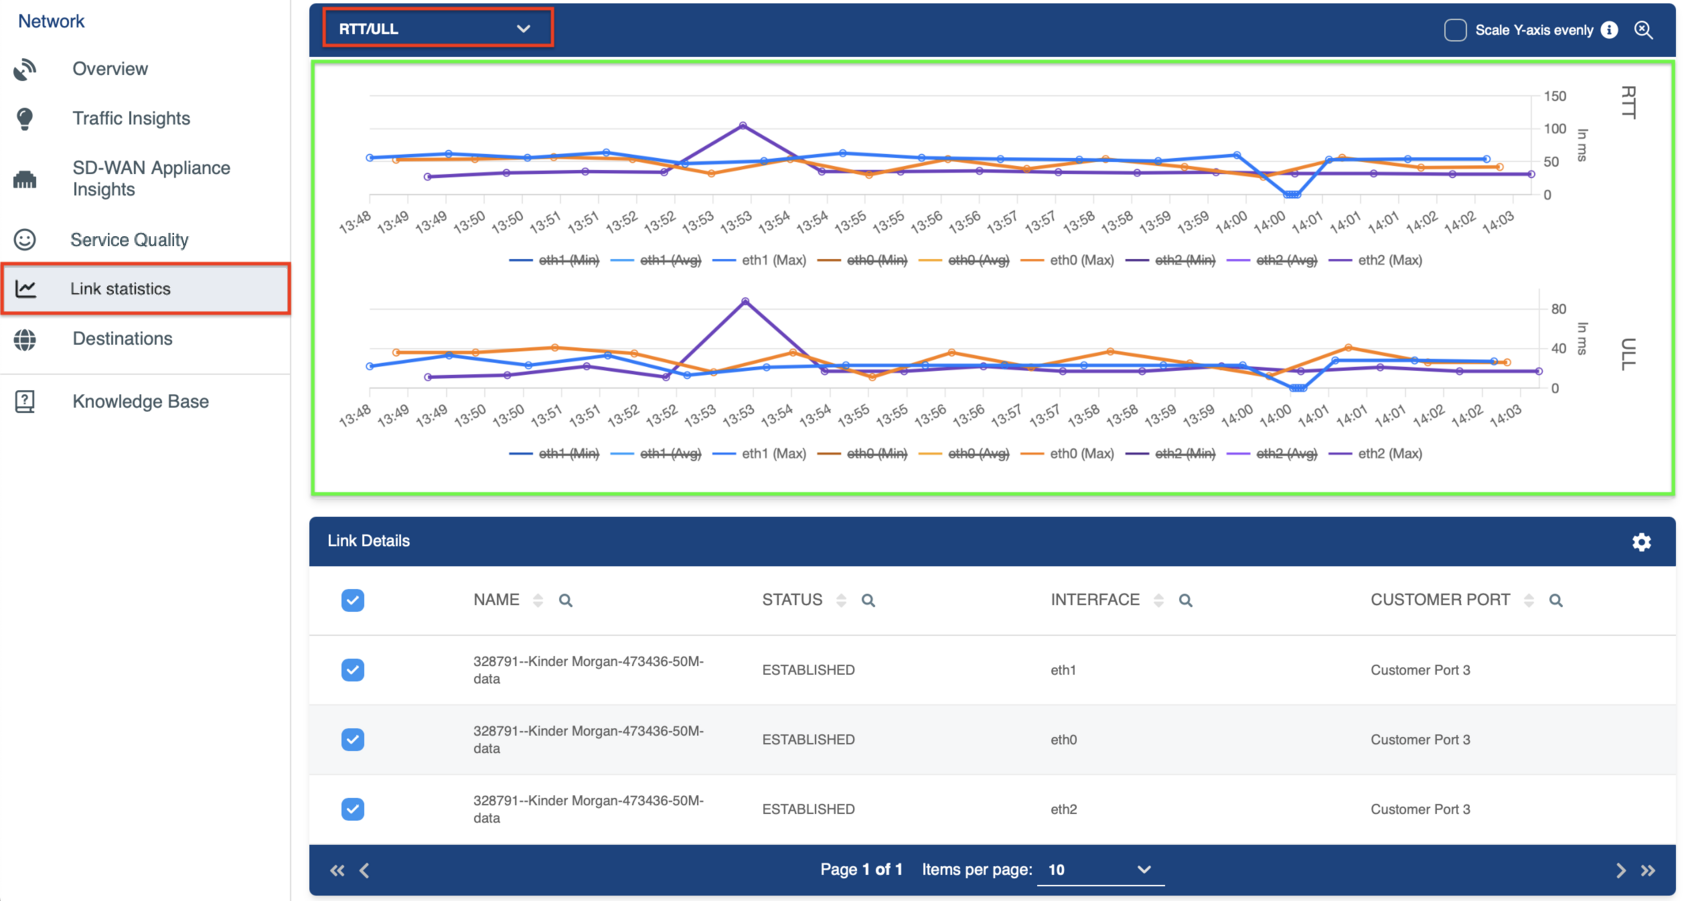
Figure 2: Round Trip Time and Ultra Low Latency for the circuit.
RTT Moving Averages
The RTT Moving Averages graph aids in identifying latency trends by smoothing out short-term fluctuations, delivering a clearer perspective on network delays over time.
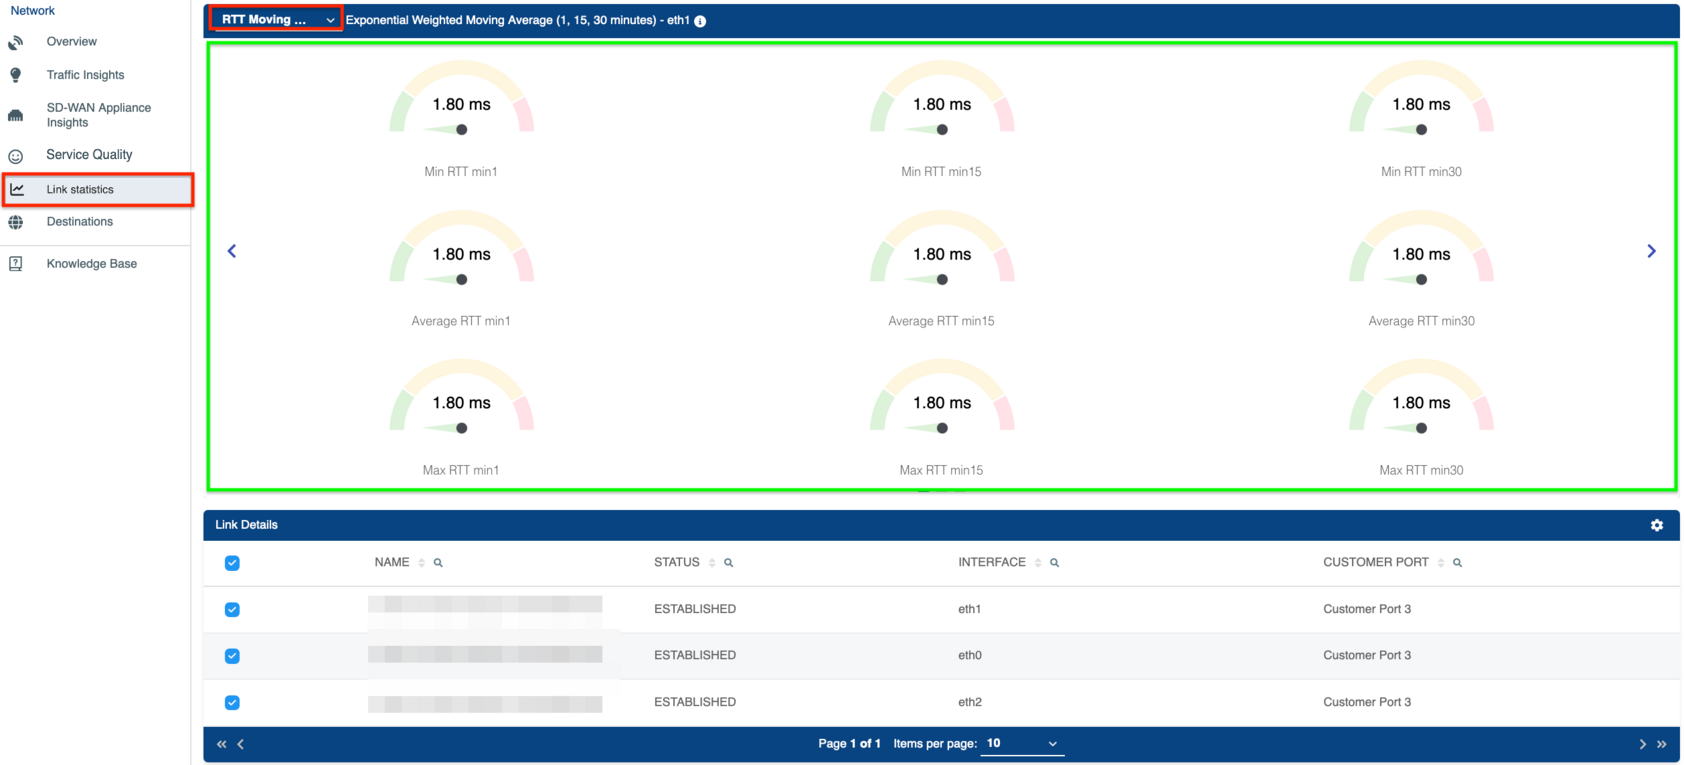 Figure 3: RTT moving averages for a more accurate reflection of latency.
ULL Moving Averages (Upper Link Latency)
The ULL Moving Averages graph tracks latency specifically on the upper link, showing trends over time.
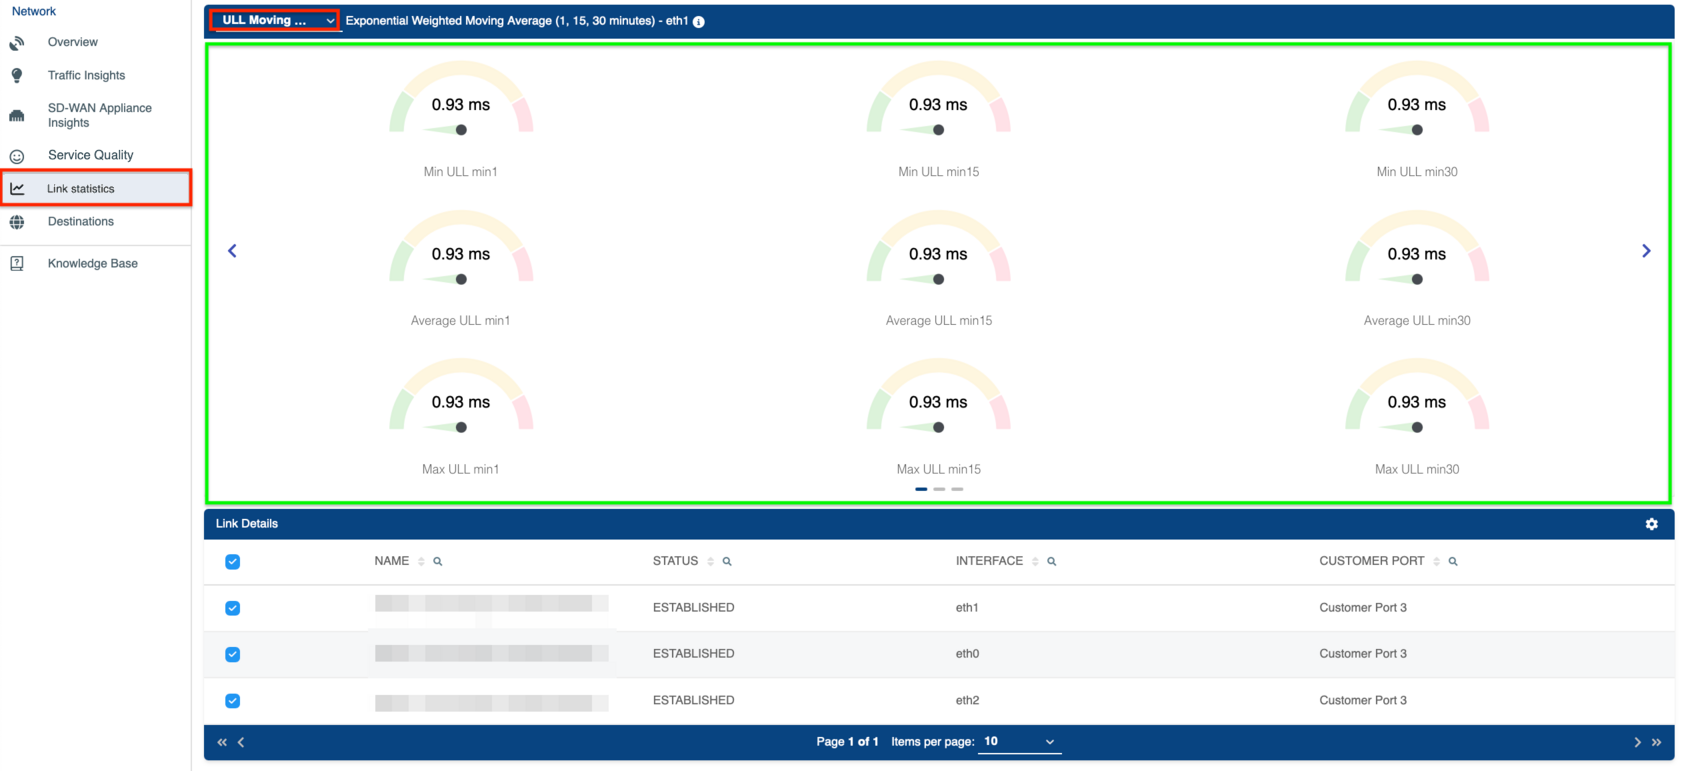 Figure 4: Upper Link Latency averages.
Jitter
The Jitter graph indicates variations in packet delay, emphasizing instability in network performance.
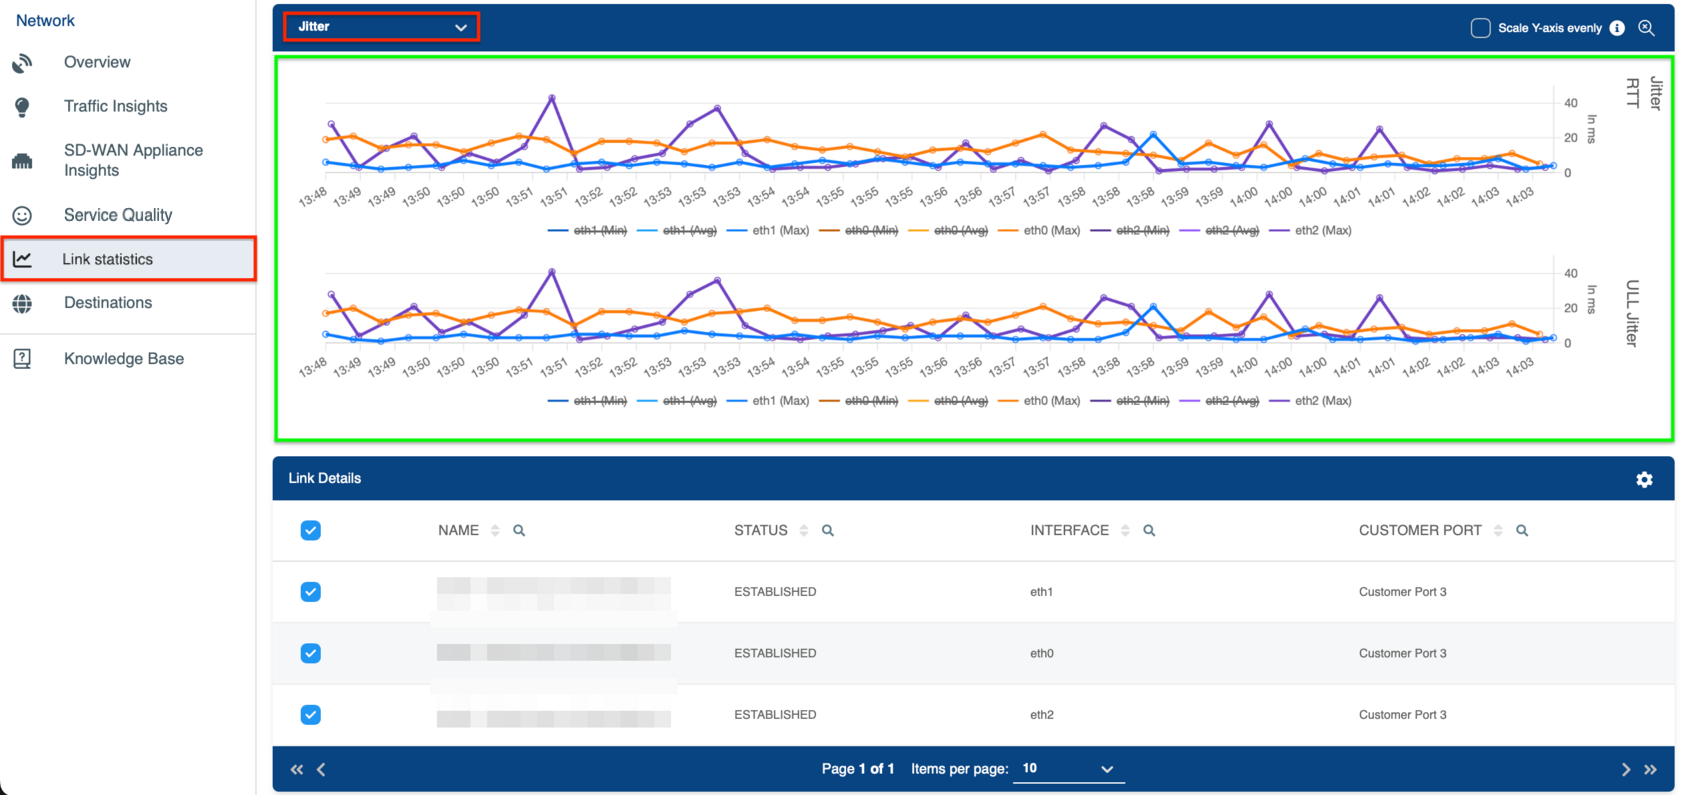 Figure 5: Jitter in packet delay over time.
Packet Loss
The Packet Loss graph displays the percentage of packets lost during transmission, which can signify network issues.
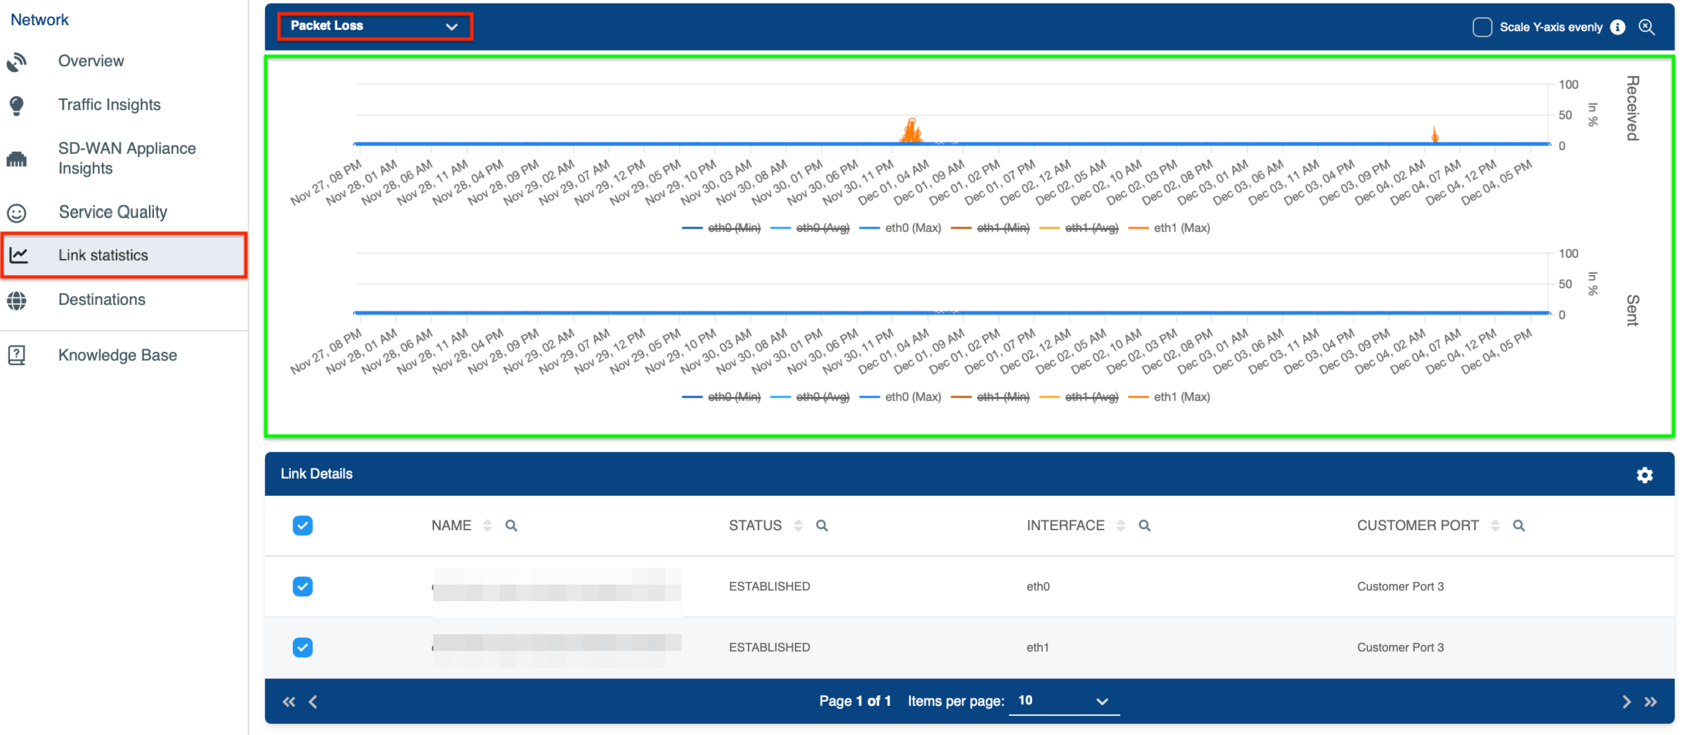
Figure 6: Packet Loss in the network.
Traffic Details Table
Each graph is complemented by a Table, where you can find more granular data, including exact values for throughput, packet loss statistics, RTT/ULL, jitter, and other metrics. This table provides further clarity on your link's performance.
Filter and Customize Results
You can filter and customize the table view in a similar way to the Overview section:
-
Search by Keywords:
- Click the (Search) icon next to the Name header to find specific items.

Figure 4: Filtering the Top Apps Table -
Reorganize Results:
- Click the arrows (Up) and (Down) next to the column headers to sort the data in ascending or descending order.
-
Select Columns to Display:
- Click the (Settings) icon to toggle the visibility of columns (e.g., Names, Bytes Received, Bytes Sent, etc.).
In Figure 6, the throughput values are shown in columns Downstream and Upstream.
By analyzing these metrics in the SD-WAN Portal, you can evaluate your network's reliability and performance, assisting in identifying potential issues or areas for enhancement.