Home
In the SD-WAN Portal, easily monitor your network's performance via the dashboard and the services table, providing a comprehensive view of network status and service health in real-time.
Explore the Dashboard Graphs
To access the dashboard:
- Log in to the SD-WAN Portal.
- You will either:
- Land on the home page directly, or
- Need to select Home from the sidebar.
The dashboard displays three performance graphs showing the status of your network:

Figure 1: Exploring the dashboard.
SD-WAN Network Status Indicators
The SD-WAN Portal monitors three key elements: Sites, Services, and Links. Status icons indicate operational health, helping administrators quickly assess network performance.
Sites
Sites are physical locations or endpoints in your SD-WAN deployment. Status indicates connectivity and availability:
- Active: Fully operational and reachable.
- Down: Offline or non-operational.
- Degraded: Partially operational, experiencing latency or packet loss.
- Pending: Being provisioned or awaiting activation.
Services
Services include SD-WAN, DIA, or E-Line offerings. Status reflects functionality:
- Active: Running smoothly.
- Down: Unavailable.
- Degraded: Operational but limited or slow.
- Pending: Being provisioned or configured.
Links
Links carry traffic between sites and services. Status helps detect connectivity or bandwidth issues:
- Active: Stable and fully operational.
- Down: Offline or disconnected.
- Degraded: Experiencing latency, packet loss, or reduced bandwidth.
- Pending: Being provisioned or activated.
You can customize which information to display by clicking on the categories to hide the other ones. For example, clicking on
Active will emphasize this category, or clicking on Degraded will hide the number of active and down services.These graphs offer a quick overview of your network's performance, helping you identify connectivity issues and service disruptions for proactive management.
Explore the Map Distribution
Below the main performance graphs, you’ll find the Map Distribution panel — a geographic overview of all network sites. This interactive map helps you quickly assess regional performance and site status.
Each pin on the map represents one or more physical sites. The color and number shown on each pin provide a quick summary of status and site quantity.
Pin Colors
- Blue: All sites at that location are ACTIVE
- Red: All sites are DOWN
- Orange: All sites are DEGRADED
- Mixed Colors (e.g., Purple, Dark Blue): The location includes multiple sites with different statuses (e.g., ACTIVE + DOWN, or ACTIVE + DEGRADED)
Pin Numbers
If a pin shows a number (e.g., 2, 3, etc.), it indicates that multiple sites are located at that specific position on the map.
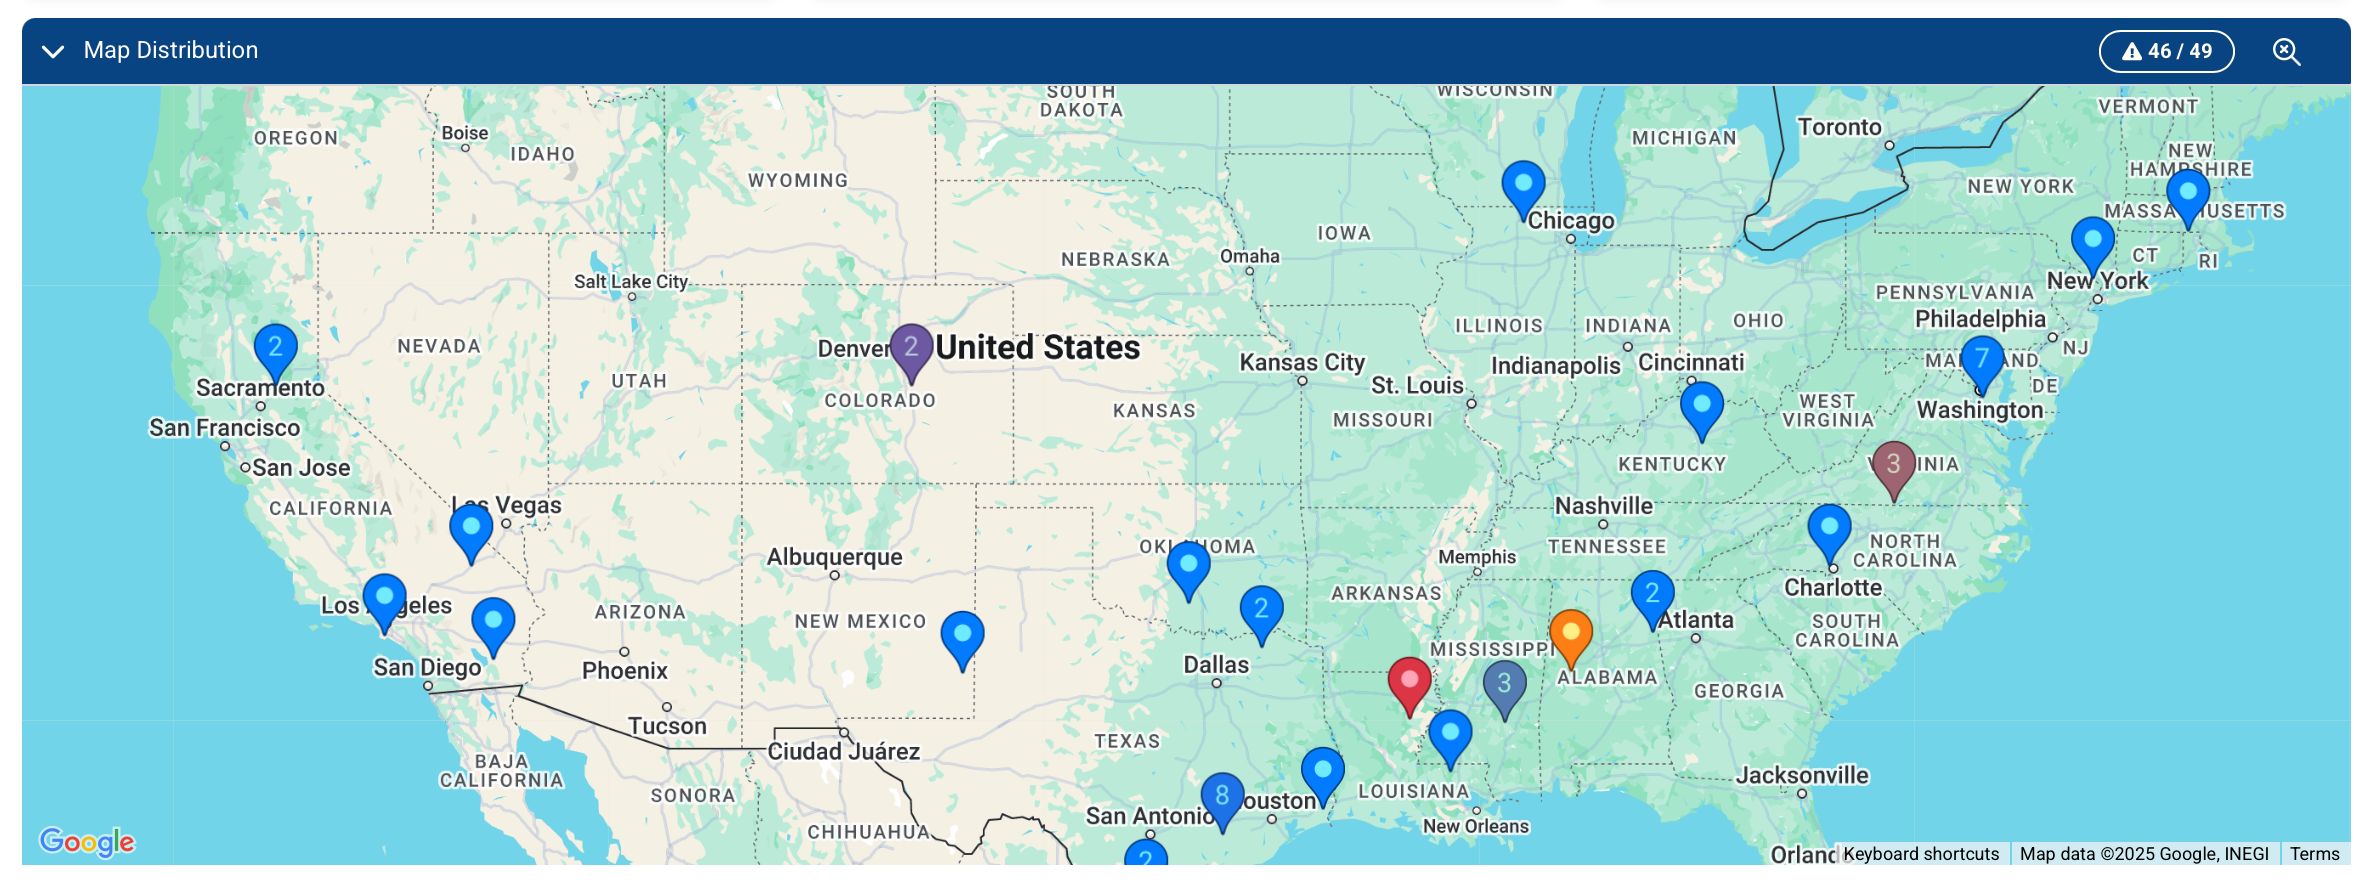
Figure 2: Map Distribution view showing grouped and color-coded pins.
To interact with the map:
-
Log in to the SD-WAN Portal.
-
You will either:
- Land on the home page directly, or
- Select Home from the sidebar.
-
In the map panel, hover over any pin to preview site details and access quick links.
-
If the pin displays a number, it represents multiple sites grouped at that location. The preview will include:
- The number of sites
- Their current status (ACTIVE, DEGRADED, or DOWN)
- The city or region
-
If the pin represents a single site, the preview will include direct links to:
Pin colors offer a fast visual reference. For detailed diagnostics, refer to the Network Overview or dashboard graphs.
This layered map view helps you spot regional issues, performance trends, and clusters with mixed statuses — enabling faster and more strategic network decisions.
Explore the Circuits Table
To access the table:
- Log in to the SD-WAN Portal.
- You will either:
- Land on the home page directly, or
- Select Home from the sidebar.
You'll see a list of all current sites and services:
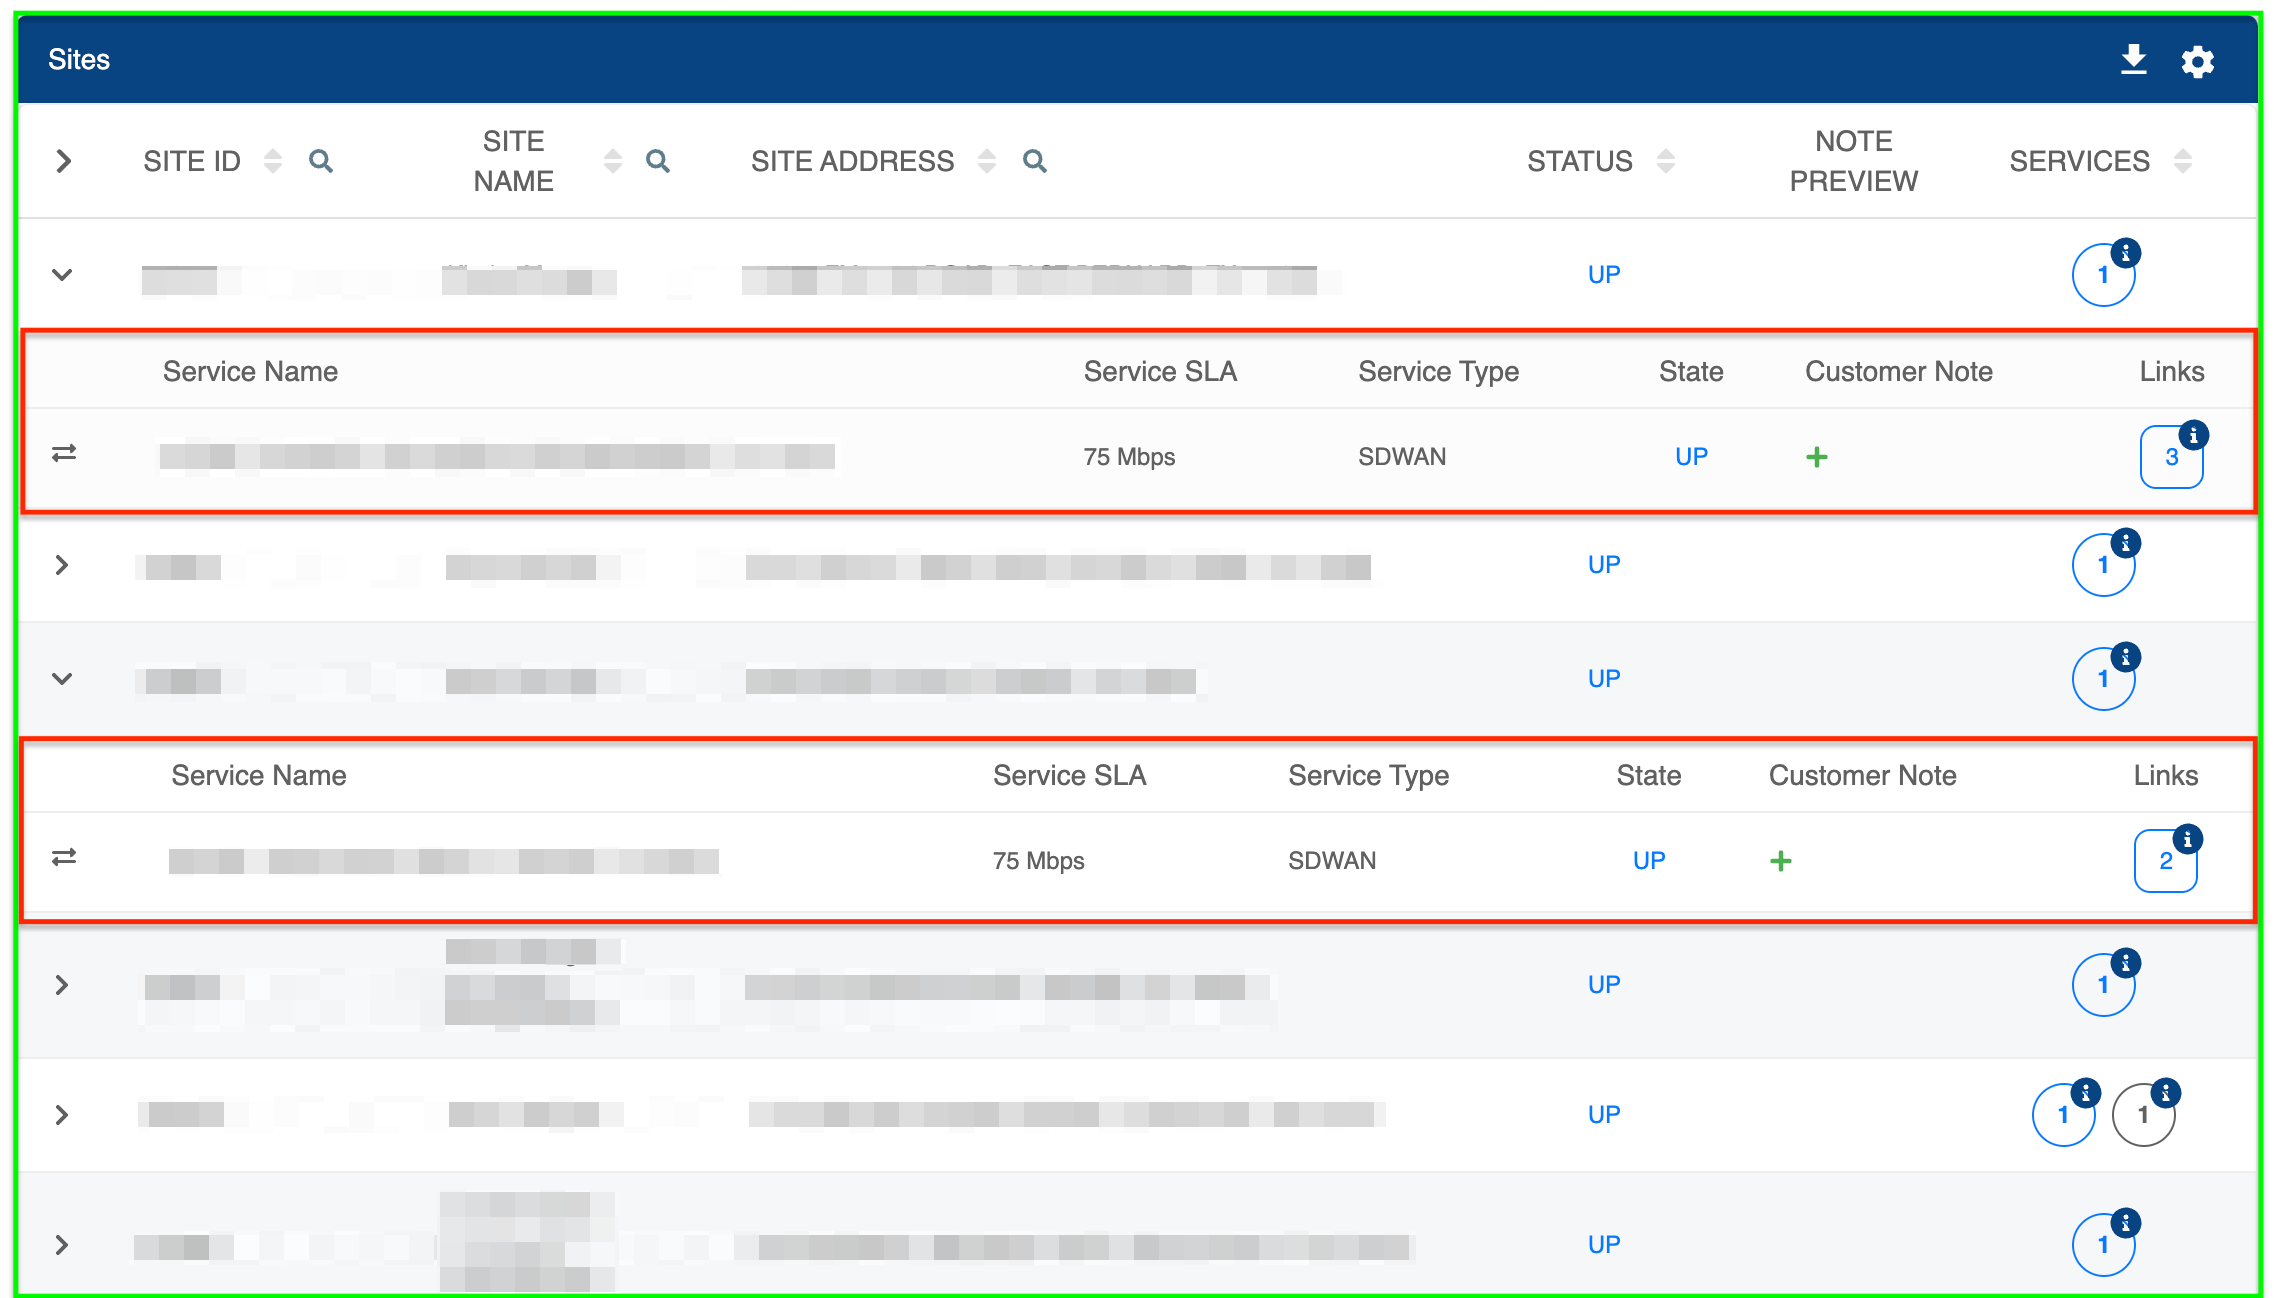
Figure 2: Exploring and filtering the sites/services table.
From the table, you can:
- Expand a site by simply clicking on it.
- Click the column headers Site ID, Site Name, Site Address, Status, and Services to organize the results in ascending or descending order.
- The Note Preview column displays notes associated with each site. These notes can store operational details such as IP addresses, credentials, or other important information. To add a note, click the icon in the Note Preview column for that site.
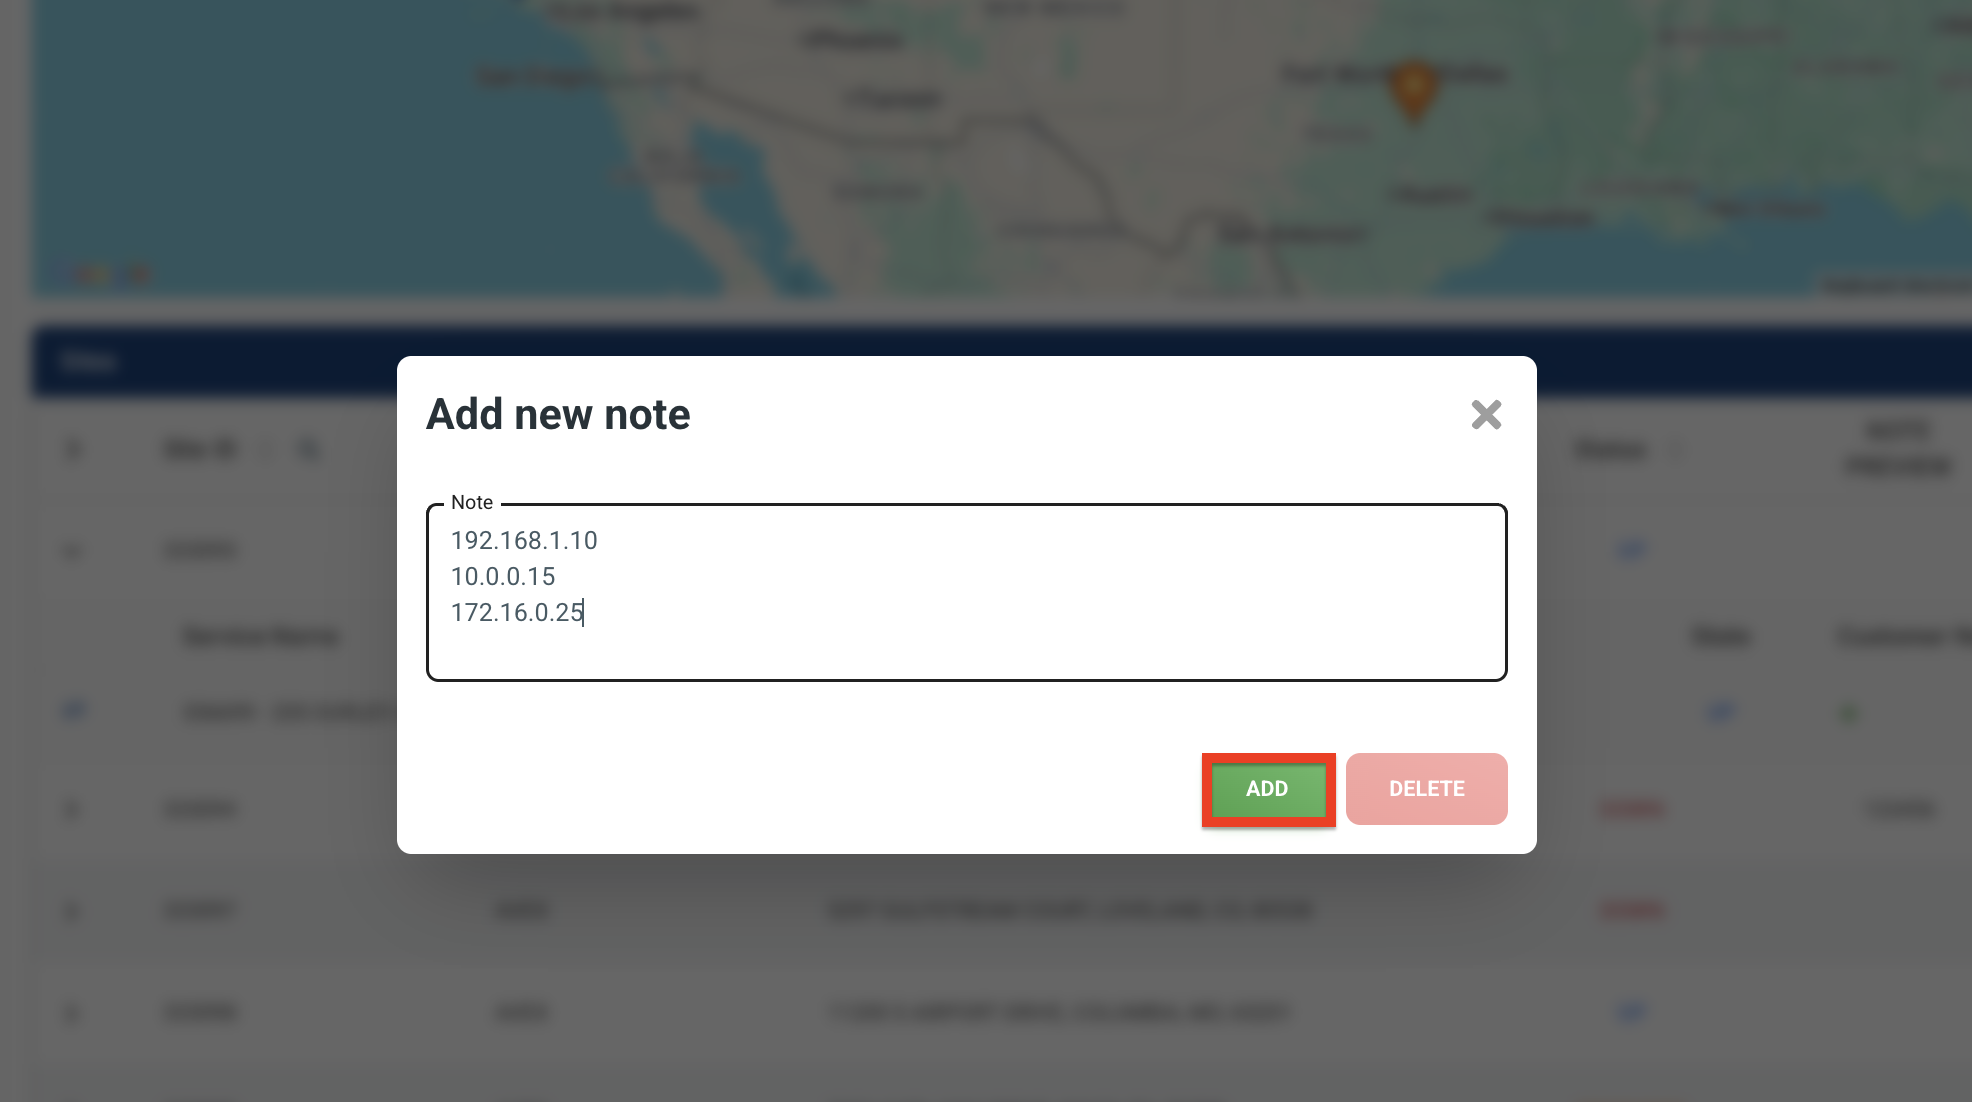
Figure 3: Adding a note to a site.
Filter Results
To filter and customize the table view:
-
Filter by keywords:
- Click the (Search) icon next to the column headers Site ID, Site Name, Site Address, Status, and Services to search for and type your search term.
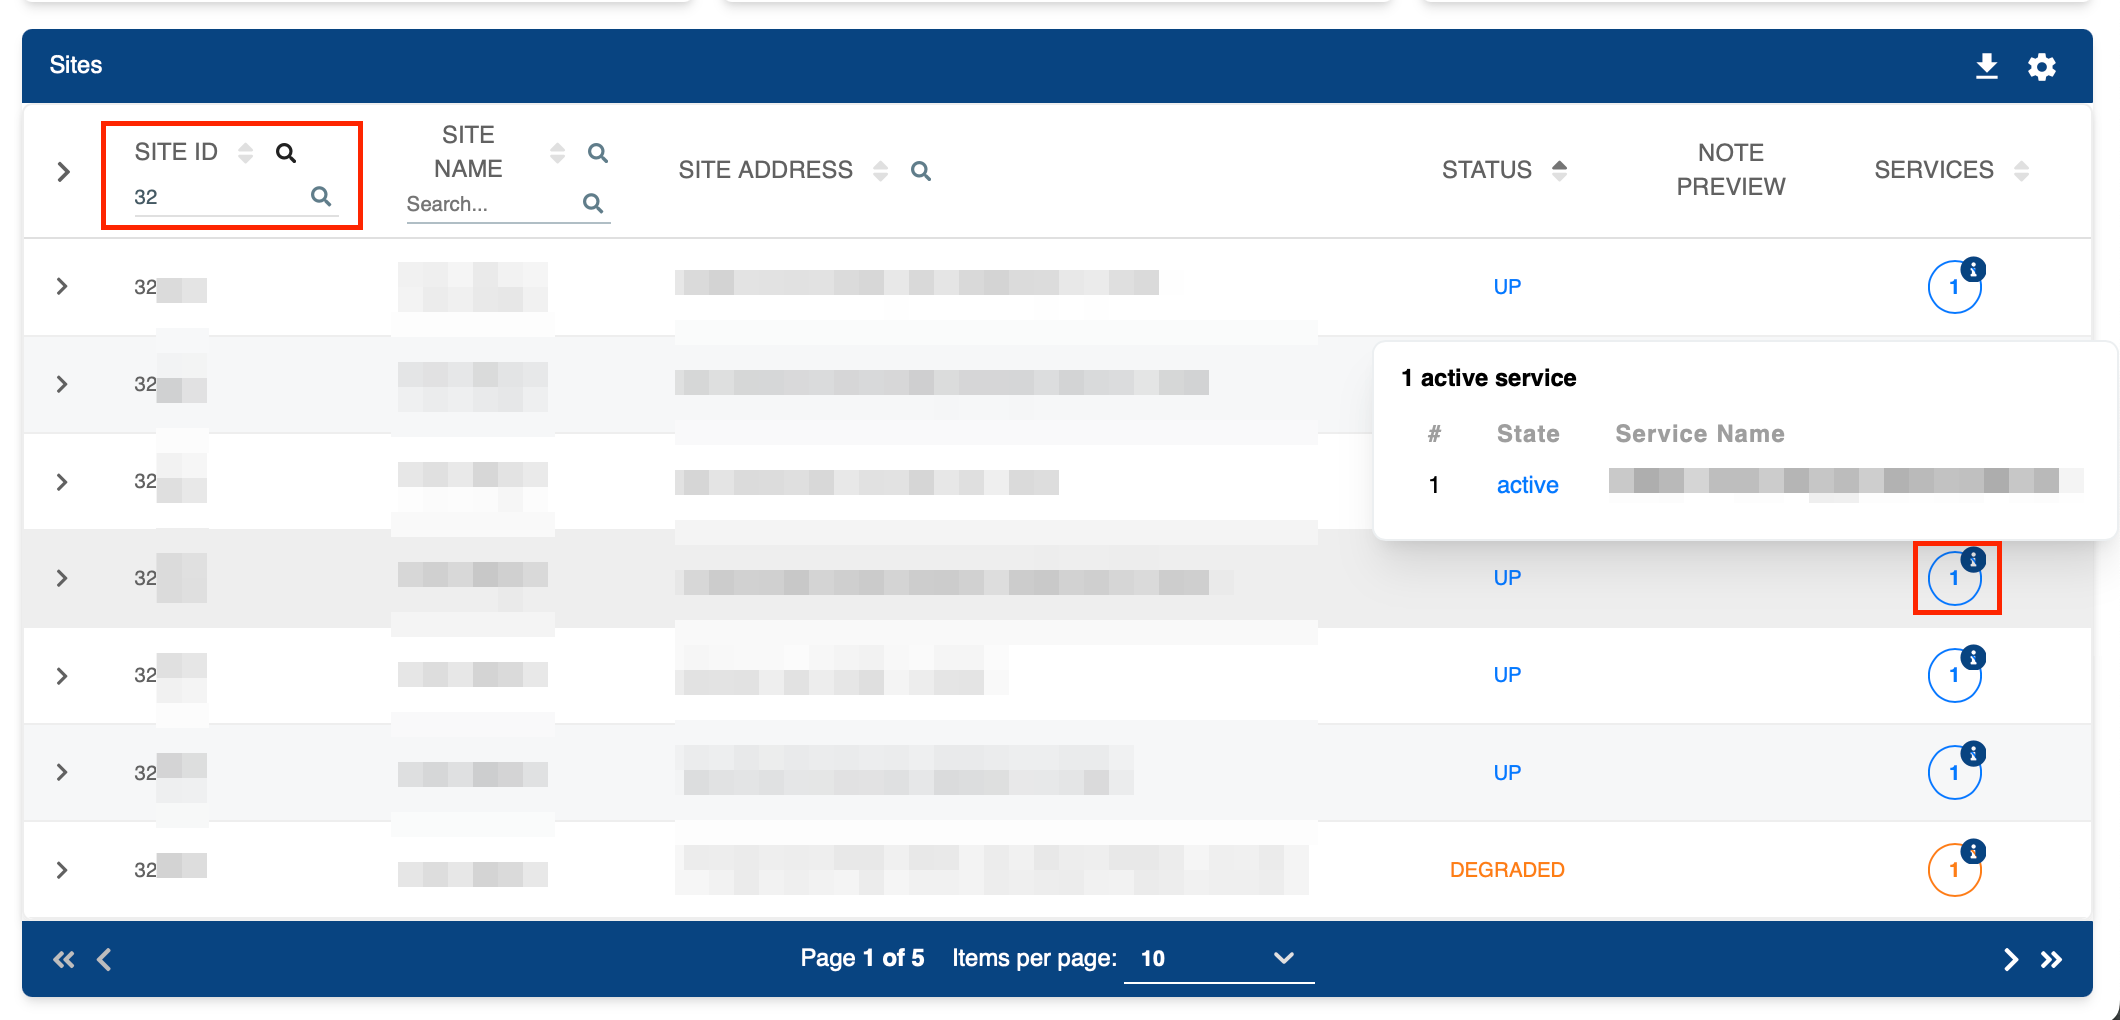
Figure 3: Filtering Site ID results starting with "32" and exploring service status.To expand and view the current Service status, click the circles under the Services header.
infoA blue status typically means your connection is ACTIVE , whereas an orange status indicates a DEGRADE connection. The values
1,2, etc. inside the circles represent the number of services. -
Choose columns to display:
- Click the (Settings) icon and deselect columns you want to hide.
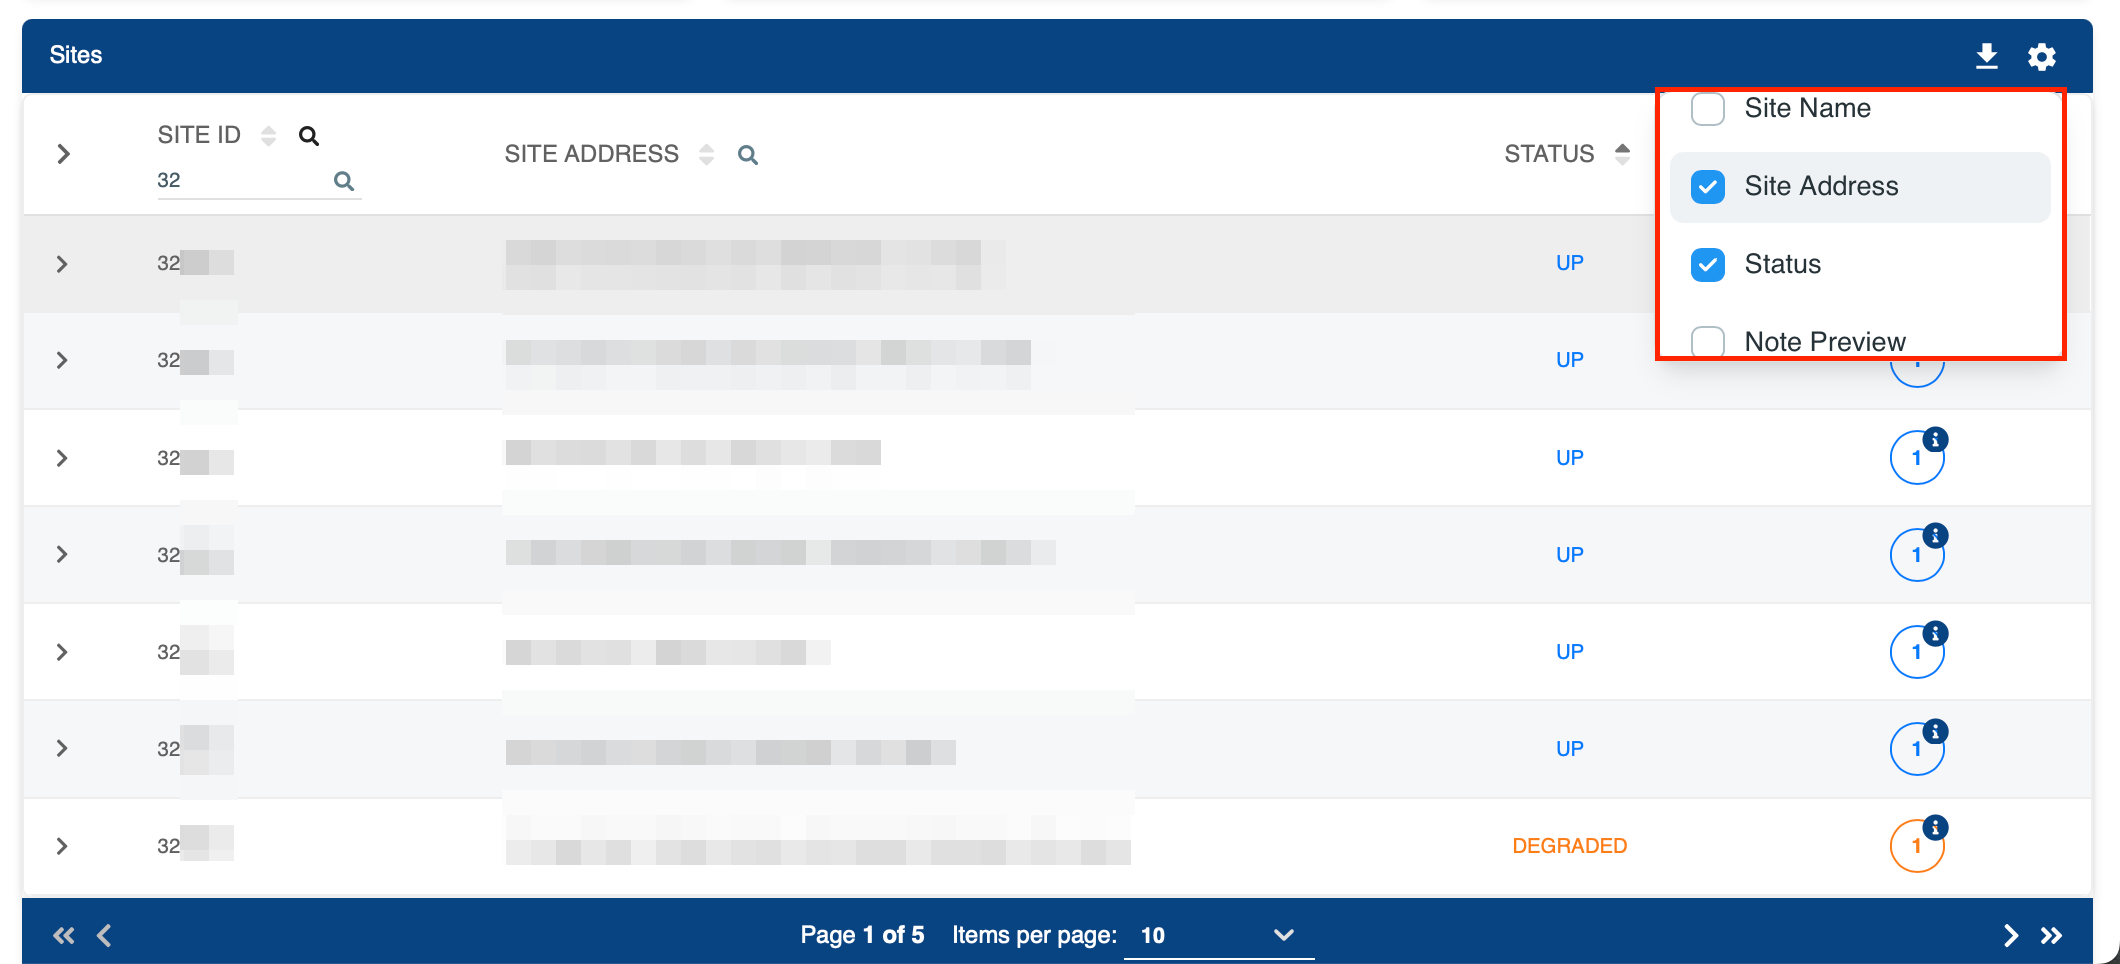
Figure 4: Customizing columns displayed in the sites/services table. -
Download Data:
- Click the (Download) icon to export the selected data to a .CSV file.
These tools allow you to easily sort, filter, and export data to suit your specific needs.
By leveraging the insights from the dashboard and services table in the SD-WAN Portal, you can effectively manage your network, ensuring optimal performance and quick resolution of any issues.